



This is my first portfolio update since I launched the Model Portfolio back on July 16, 2026. I’ll be publishing one of these every month going forward, so you always know exactly what’s changed, what I bought, what I sold, and why.
Let’s start with the headline number. Since inception, July 16 through September 1, the portfolio is up +6.19%. The S&P 500 is up +2.03% over that same stretch. The portfolio started with $100,000 and is now worth $106,193.
Below is the composition of the portfolio:
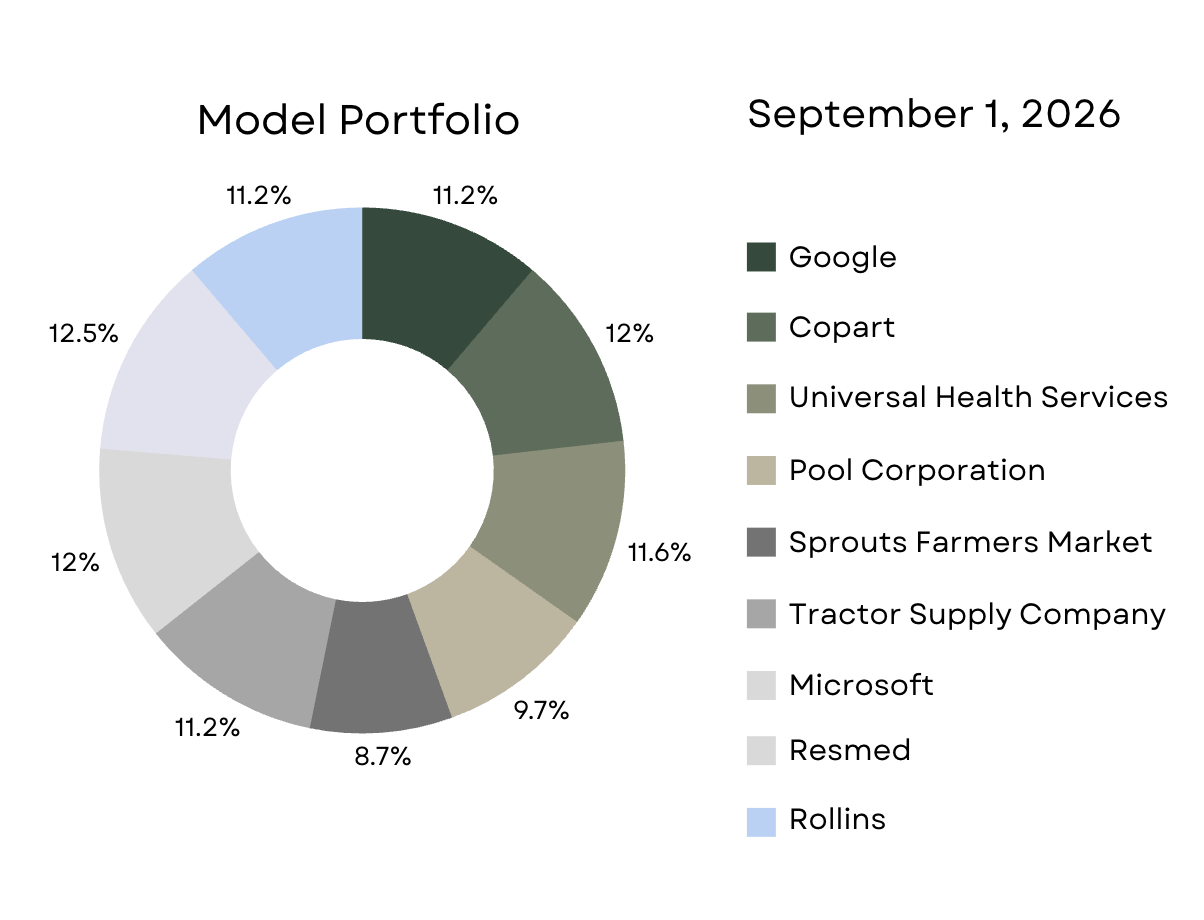
The table below is the full record, showing entry date and price, current price, dividend yield, total return per position since entry, and current valuation zone. Think of it as the detailed version of the snapshot in the chart above, everything the pie chart summarizes in color, broken back out into numbers.
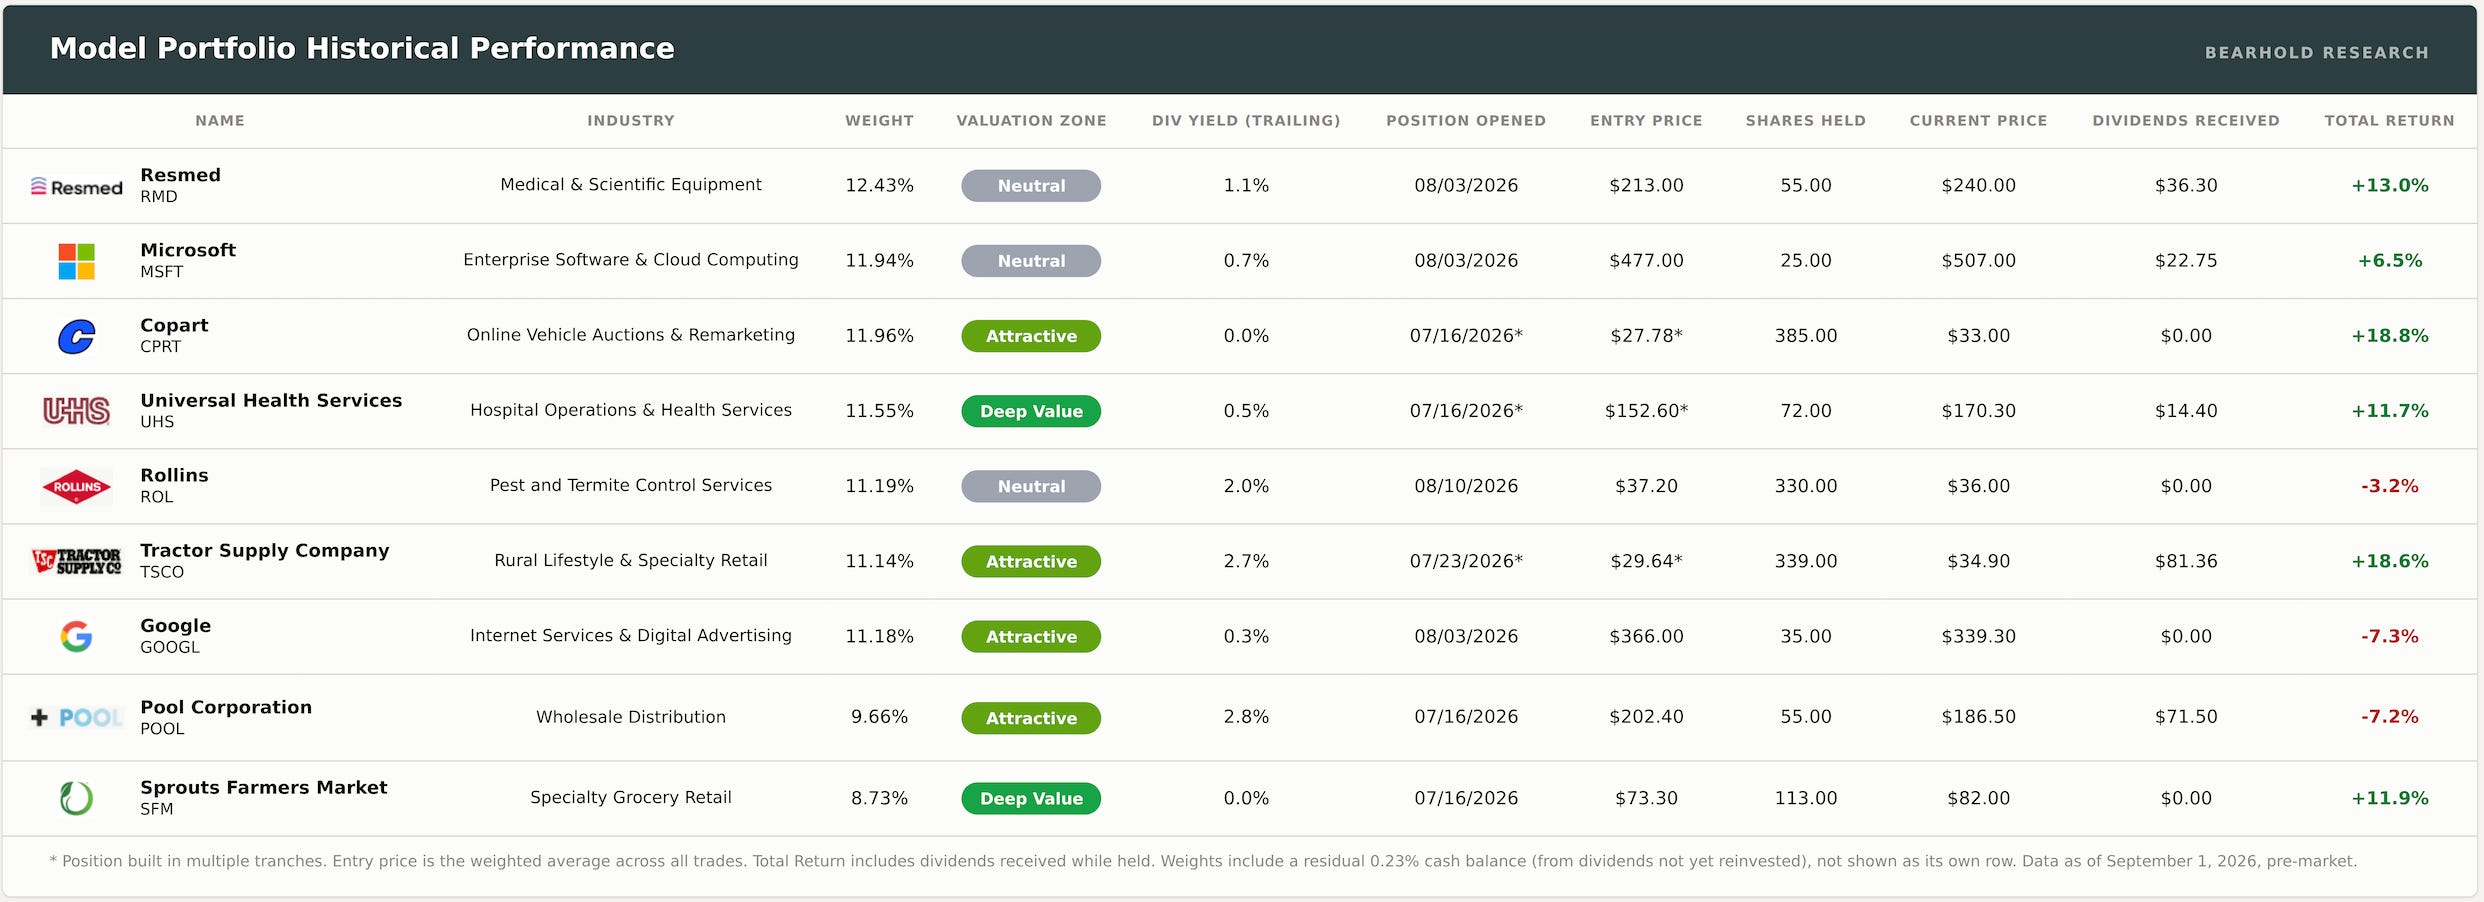
Portfolio Activity
Every new name below was opened in full view. I shared notes on Substack with readers as I opened each one, so there’s a public, timestamped record proving exactly when I entered every position for the first time. The one exception is the follow-on additions to three names I already held; UHS, Copart, and Tractor Supply. Those top-ups deployed remaining cash into existing positions rather than opening new ones, they’re fully reflected in the blended entry prices and returns below. Here’s the story of how this portfolio actually got built, one name at a time.
ResMed (RMD)
A platform business for obstructive sleep apnea, with thirty million cloud-connected patients and a proprietary data advantage that compounds with every device sold, in a market where fewer than 20% of people who need the product have ever received it. The position is up +13% since entry, and it also went ex-dividend on August 20, adding a bit of income on top of the price move.
Opened: Aug 3 at $213 | Current Zone: Neutral | Ex-Dividend: Aug 20
Read full company report here
Microsoft (MSFT)
An enterprise undergoing one of the most significant physical and operational transformations in corporate history, as AI infrastructure spending reshapes its capital base. The position is up +6.5% since entry, with a dividend on August 20 adding a little to the total.
Opened: Aug 3 at $477 | Current Zone: Neutral | Ex-Dividend: Aug 20
Read full company report here
Copart (CPRT)
One of the most quietly exceptional businesses in the country, dominating online salvage vehicle auctions with a land position that is almost impossible for competitors to replicate, and customers with no viable alternative. The position is up +18.8% since entry. Copart doesn’t pay a dividend, so the return here is entirely price. I built this one in two tranches: the first on July 16, the very first day of the portfolio, at $27.30, and a second on August 3 at $29.60, blending to an average cost of $27.78.
Opened: Jul 16 & Aug 3 (avg $27.78) | Current Zone: Attractive | Ex-Dividend: None
Read full company report here
Universal Health Services (UHS)
One of the largest behavioral health networks in the world, built inside a gap in American healthcare that has historically attracted less capital and less institutional attention than any other major category of inpatient care. The position is up +11.7% since entry, and it went ex-dividend on September 1, adding a bit of income to the total. I built this one in two tranches as well: July 16 at $148, then August 3 at $168.70, blending to $152.60.
Opened: Jul 16 & Aug 3 (avg $152.60) | Current Zone: Deep Value | Ex-Dividend: Sep 1
Read the full company report here
Rollins (ROL)
A route-based recurring revenue platform built on pest control, where roughly three quarters of revenue renews automatically on a fixed schedule, with 24 consecutive years of revenue growth including through the 2008 crisis and the pandemic. The position is down -3.2% since entry. Rollins went ex-dividend the same day I opened it, which means I don’t get credit for that payout.
Opened: Aug 10 at $37.20 | Current Zone: Neutral | Ex-Dividend: Aug 10 (no credit, same-day entry)
Read the full company report here
Tractor Supply Company (TSCO)
The largest rural lifestyle retailer in the United States, with 30-plus consecutive years of revenue growth. The stock had fallen roughly half from its 2025 peak while the underlying business held onto nearly all of its pandemic-era gains, a normalization I read as the market pricing deterioration that wasn’t really there. The position is up +18.6% since entry, with a dividend collected in August adding to the total. I built this one in two tranches: July 23 at $29.30, then a top-up on August 3 at $31.40, blending to $29.64.
Opened: Jul 23 & Aug 3 (avg $29.64) | Current Zone: Attractive | Ex-Dividend: Aug 24
Read the full company report here
Google (GOOGL)
No longer just a search advertising company. Google Cloud swung from a $3.1 billion operating loss in 2021 to a $13.9 billion profit in 2025, while the core search business keeps growing alongside it rather than being cannibalized by it. The position is down -7.3% since entry, and there’s no dividend cushion in this window since its next payout falls outside it.
Opened: Aug 3 at $366 | Current Zone: Attractive | Ex-Dividend: None
Read full company report here
Pool Corporation (POOL)
The largest wholesale pool distributor in the world, sitting between manufacturers and roughly 125,000 contractors and retailers, with a maintenance revenue base that doesn’t disappear in a downturn since existing pools still need upkeep regardless of the economy. The position is down -7.2% since entry, and a dividend was collected on August 13.
Opened: Jul 16 at $202.40 | Current Zone: Attractive | Ex-Dividend: Aug 13
Read full company report here
Sprouts Farmers Market (SFM)
Not a produce stand with a grocery section attached, but a full grocery store rebuilt around fresh food from the ground up, with decades of site selection data and supplier relationships that a competitor can’t shortcut by simply adding an organic aisle. The position is up +11.9% since entry. Sprouts doesn’t pay a dividend, so like Copart, the return here is entirely price. I opened this one on day one as well, July 16, at $73.30.
Opened: Jul 16 at $73.30 | Current Zone: Deep Value | Ex-Dividend: None
Read the full company report here
Closed positions
Wingstop (WING)
I opened this position on July 16, right alongside the rest of the day-one lineup, at $146 a share. I didn’t hold it long. By July 29, just thirteen days later, I closed it out at $144, a realized loss of $114.38, or about -1.4% on the position. The decision came down to the second-quarter results, which extended a streak of same-store sales declines to the point where I could no longer wave it off as weather and tough comparisons.
How I Measure Valuation
Most equity research focuses on identifying a single “fair value” price target. I avoid that approach because pinning a precise number on a company that could compound for decades implies a degree of certainty that simply doesn’t exist.
Instead, I look at valuation through a more practical lens; at today’s share price, how many years of that company’s future cash flow are you actually paying for?
Here is the intuition. A stock’s price is really a claim on all the cash the business will ever generate, discounted back to today’s dollars. When we say a stock has, for example, 18 embedded years, we mean the current price accounts for the next 18 years of the company’s projected free cash flow. Everything the business earns after year 18 is not priced in at all. You get it for free, as long as the business keeps performing.
The fewer embedded years you pay for, the more of the company’s future upside you receive at zero cost, and the greater your margin of safety if something goes wrong. That is why embedded years serve as a vital risk metric, not just a valuation tool. A stock pricing in 40 years of cash flow demands four decades of flawless execution, and long-range forecasts become exponentially less reliable the further out you look.
Forward valuation
The strategy is simple, buy when a stock is in the undervalued zones, and sell when it becomes expensive.
I sort every holding into one of five valuation zones, from the most undervalued to the most expensive: Deep Value, Attractive, Neutral, Stretched, Exorbitant. What each zone means is explained in the table below.
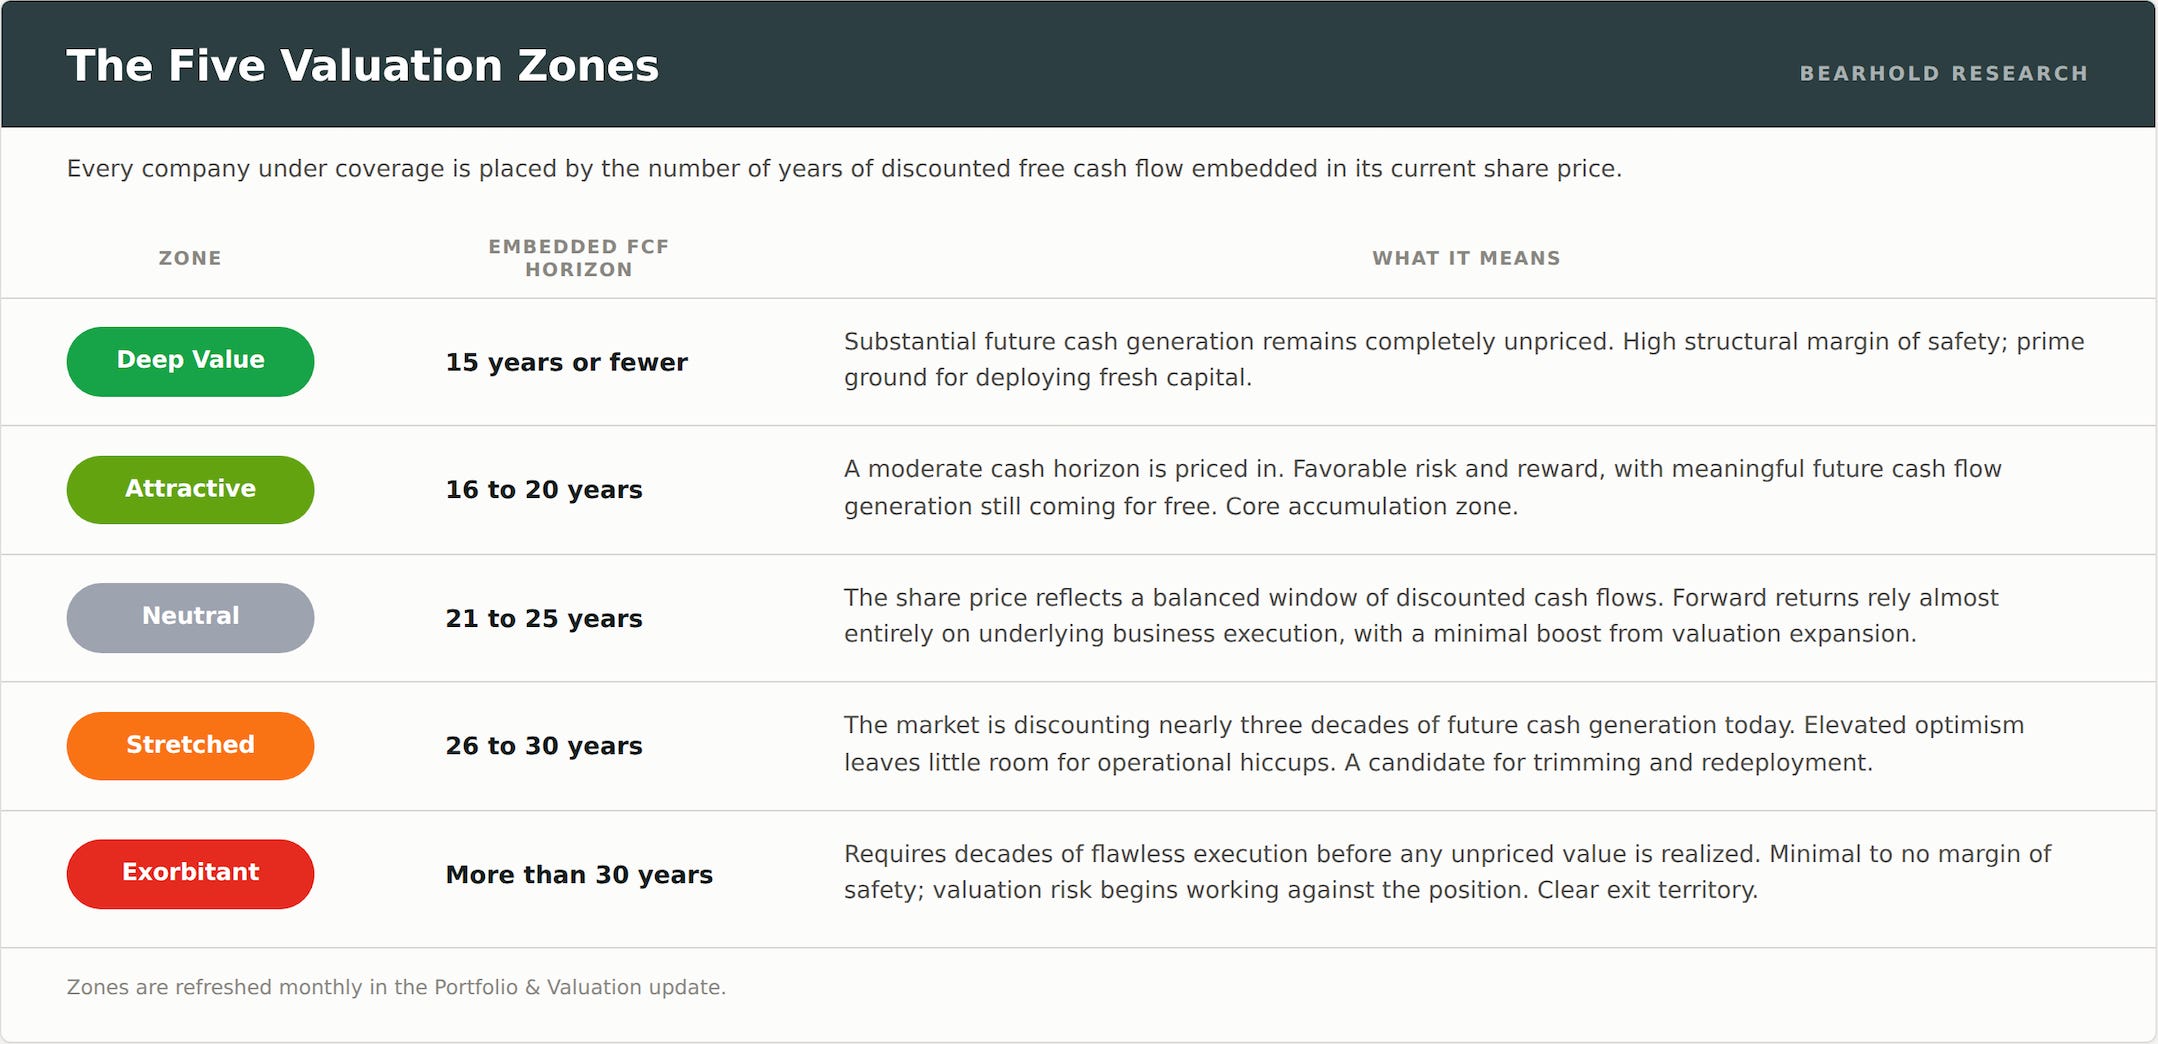
An approved business is held for as long as its valuation stays favorable. Once a holding drifts into Stretched or Exorbitant, valuation risk starts working against you, so I look to trim or exit and move that capital into another approved name that is still cheap.
The table below is refreshed monthly and shows which zone each approved name's current price falls into. This is important for initiating new positions, and for trimming or exiting existing ones.
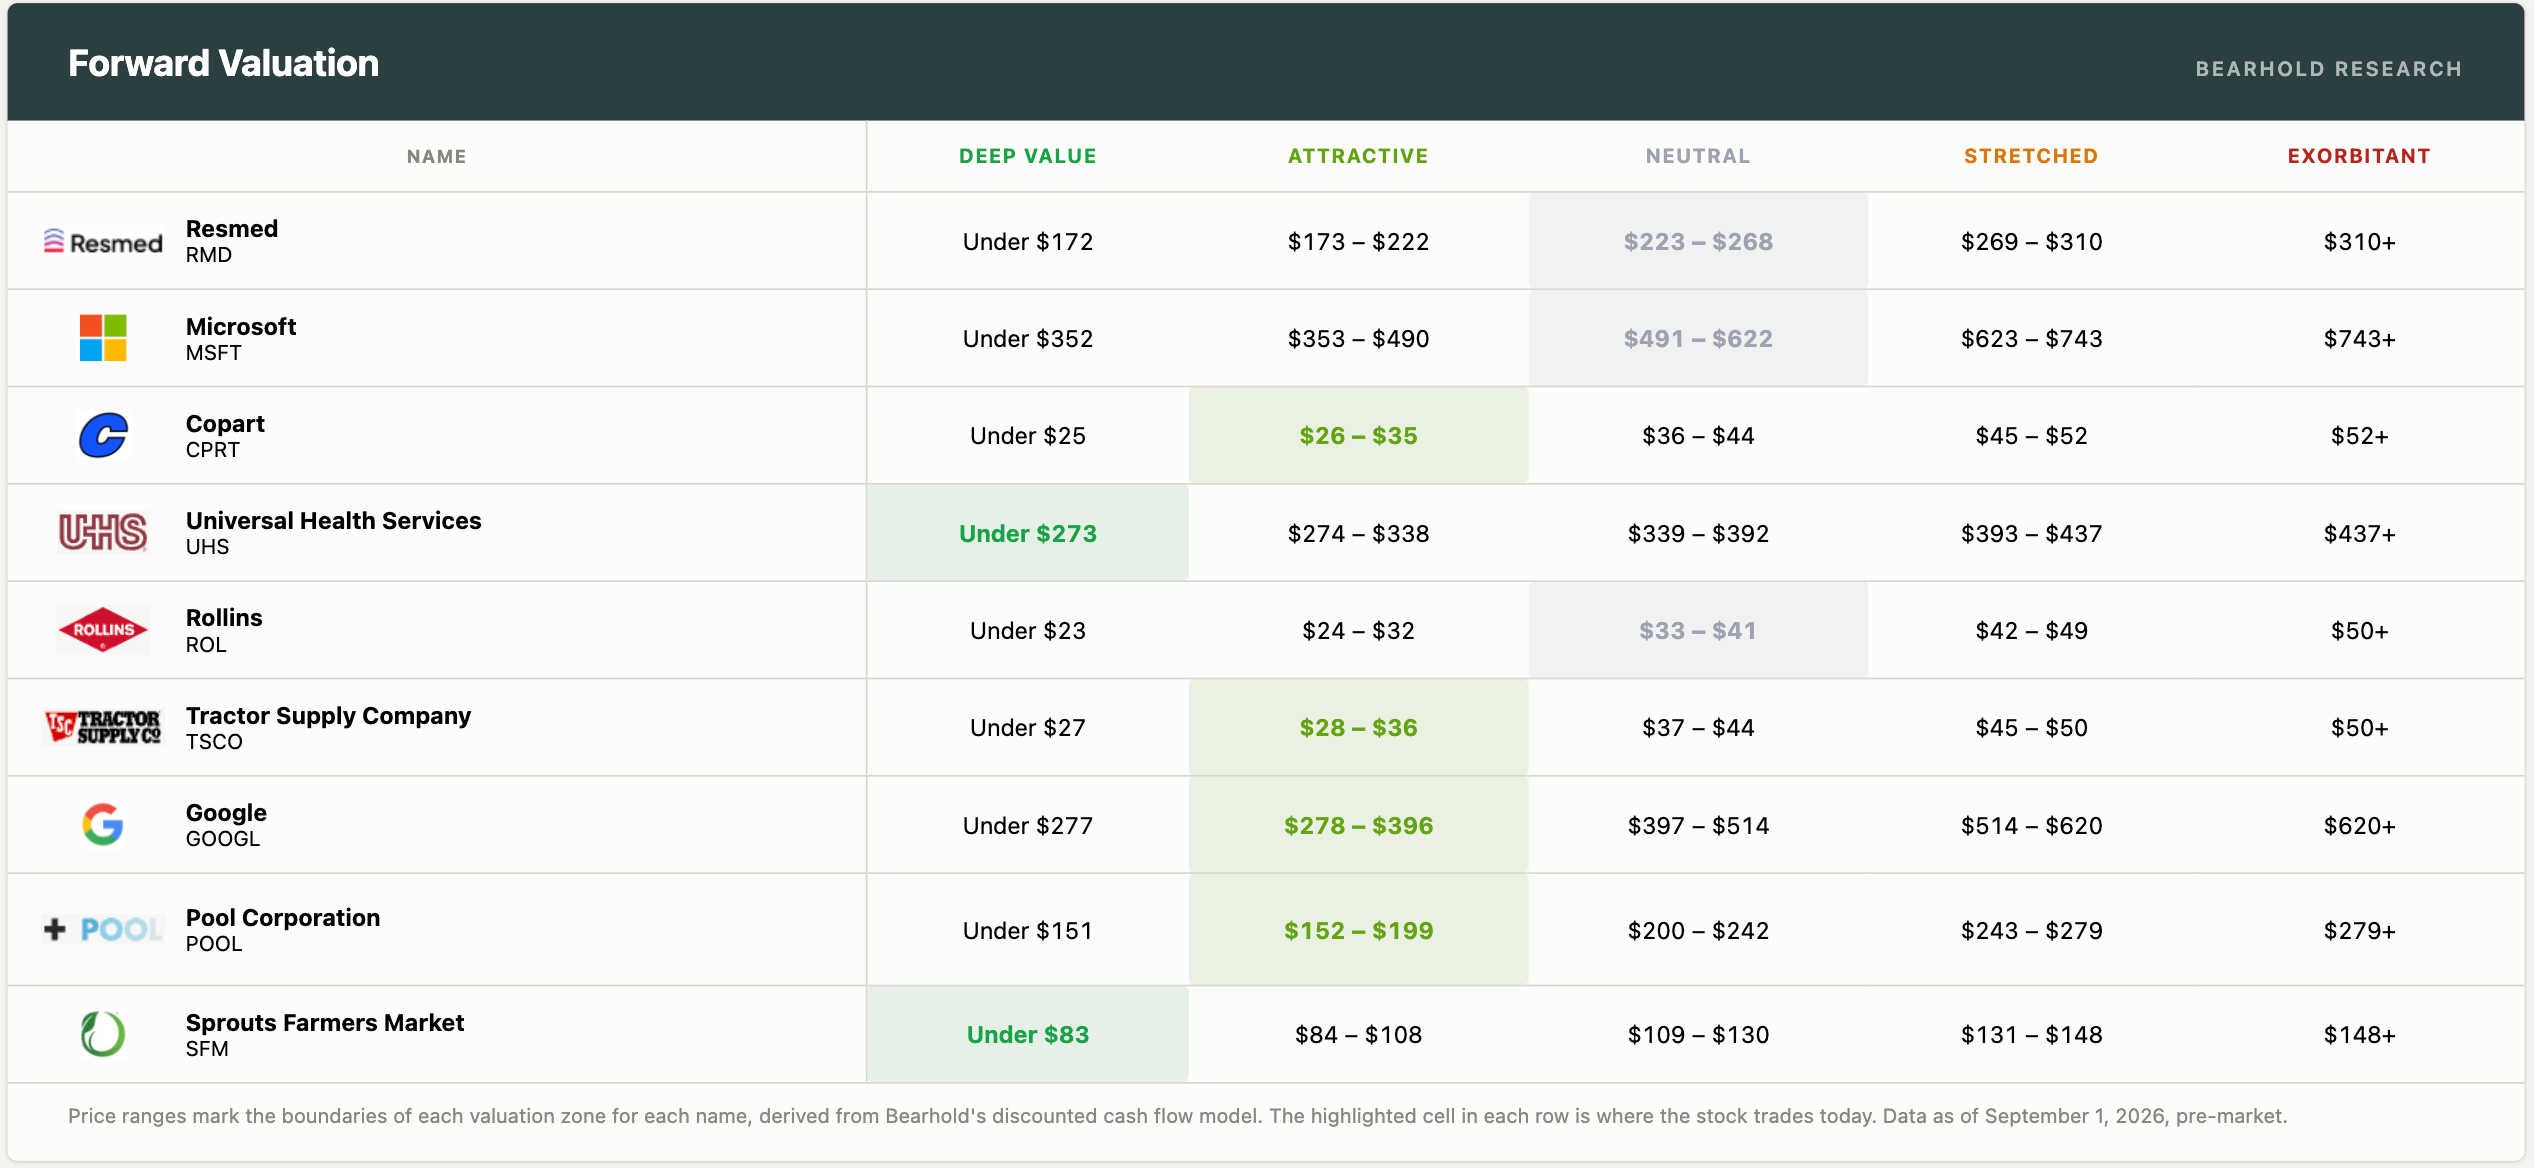
That's the full picture for the first seven weeks. I'm holding off on the broader valuation roundup for the rest of the Approved universe this month, since the list outside the portfolio is still thin.
This model portfolio is for informational and educational purposes. It does not constitute personalized investment advice. Actual results for any individual investor will differ based on entry timing, position sizing, and the extent to which portfolio guidance is followed. Past performance does not guarantee future results. Read full disclosure here.