




Executive Summary
Alphabet is still widely understood as a search advertising company. For most of the last decade, that was a fair description, but it’s no longer true.
Over the last five years, the company built a second real profit engine in Google Cloud, which moved from a $3.1 billion annual operating loss in 2021 to a $13.9 billion profit in 2025.
Crucially, the core business isn’t slowing down to make room for this growth, nor is AI killing it off. Search revenue grew 13.2% in 2025. Even better, paid clicks went up 6% while cost-per-click rose 7%. When both metrics move up together, it proves AI Overviews are creating more monetizable searches and are not killing off traditional clicks.
Three core drivers explain this transition:
Distribution: Google still owns the gateways to the internet. It holds over 85% of global search market share, sits on more than 3 billion active Android devices, and controls over 65% of browser usage via Chrome. That reach becomes even more powerful as user behavior moves from simple search boxes to AI assistants.
In-house silicon: By designing its own TPUs instead of relying solely on expensive, off-the-shelf GPUs, Google drives down its internal compute costs faster than competitors relying on market rates. That structural cost advantage compounds as inference costs fall across the industry.
Cloud margin expansion: Google Cloud’s operating margin swung from -16.1% in 2021 to 23.7% in 2025. On top of that, its contracted backlog has more than doubled since late 2025. That shows enterprise clients are actually spending real money on these AI tools.
Still, there are two real risks here, whether AI search tools eventually steal actual market share from Google, and whether the massive AI capex, on track for $175 to $185 billion in 2026, will actually yield an acceptable return on capital anytime soon. Both will be covered in detail in the report. But weighed against what the business has actually delivered over the last five years, I’d call it Approved; a two-decade-old moat that’s come out more profitable, from every platform shift thrown at it, now running a second engine underneath it that didn’t exist five years ago.
The author does not hold a position in Alphabet, Inc. at the time of publication. This report reflects the author’s personal views and is not investment advice. Investing carries the risk of permanent capital loss. Read full disclosure here.
1. The Business
What it Does
Whether you search for something online, open YouTube, or pull up directions on your phone, Alphabet is almost always somewhere in that loop, and getting paid for it. At its core, the company is an ad machine sitting on top of daily utility products like Search, YouTube, Maps, Gmail, Chrome, and Play. Advertisers pay to show up where attention already goes, and Alphabet takes a cut off the top.
Beyond advertising, Google Cloud rents out compute, storage, and AI capacity to companies that don’t want to build their own data centers. Then there’s Other Bets, a collection of moonshots funded by the core business’s cash flow. Waymo is the biggest and most visible, but the bucket also holds Verily (life sciences), Calico (longevity research), Wing (drone delivery), and venture arms like GV and CapitalG.
Underneath almost all of this sits Gemini, Alphabet’s AI model family, powered by their custom chips. Gemini flows through their consumer lineup, including AI Overviews in Search, the standalone app, and features across Docs and Gmail. It is also what Google Cloud sells to business clients.
Running this at global scale only works because Alphabet uses its own silicon. Their Tensor Processing Units run AI workloads far cheaper than the standard Nvidia GPUs most competitors buy or rent.
How the Company Makes Money
The ad business runs on an auction system. Advertisers bid for placements across Search, YouTube, and millions of third-party sites in the Google Network. Alphabet gets paid when someone clicks a performance ad or views a brand ad. From that revenue, it pays distribution partners and site publishers a fee called traffic acquisition costs. Whatever stays in the account after those payouts is Alphabet’s net take.
Outside of advertising, Google Services brings in recurring subscription revenue through YouTube Premium, YouTube Music, YouTube TV, and Google One. It also takes a cut of app sales and in-app transactions on Google Play, alongside direct hardware sales from Pixel devices.
Google Cloud operates under a different financial model entirely: clients pay consumption-based usage fees for infrastructure and AI services, monthly subscriptions for Google Workspace, and direct purchase fees for TPU hardware systems sold to companies that prefer owning their infrastructure outright.
Scale and Footprint
Alphabet generated $402.8 billion in revenue in fiscal 2025. The US accounts for roughly half of total sales, followed by EMEA at 28–30%, APAC at 16–17%, and the remainder across non-US Americas. Headcount stood at roughly 191,000 employees at year-end 2025.
Powering this operation is a vast physical backbone. Technical infrastructure and data centers totaled $246.6 billion on the balance sheet at the end of 2025, built out to handle Search, YouTube, and AI model training at global scale. Alphabet has now deployed seven generations of custom TPU chips across this network, keeping its compute stack tailored specifically for AI workloads.
Governance also matters for long-term holders. Alphabet uses a dual-class voting structure established at its 2004 IPO: Class A shares carry one vote per share, Class C shares carry no votes, and Class B shares carry ten votes per share. Because Larry Page and Sergey Brin hold almost all the Class B shares, they retain majority voting control over the company regardless of their actual economic stake.
2. The Moat
Alphabet’s position rests on four interconnected advantages; default distribution, a massive data feedback loop, custom chip economics, and enterprise cloud stickiness.
1. Default Distribution
Google owns the main entry points to the web. Between revenue-sharing deals, 3+ billion active Android devices, and Chrome holding over 65% browser market share, Alphabet controls default search placement on most devices. As search shifts toward conversational AI, controlling the underlying OS and default browser gives Alphabet the strongest defensive position in the market.
2. The Data Feedback Loop
That distribution fuels a massive data loop. Google processes trillions of searches a year with over 85% market share. Each query provides commercial intent signals that refine ad pricing and search relevance. That scale flows straight into their AI models: the Gemini 3 family handles over 22 billion tokens per minute across developer APIs, while the standalone Gemini app has passed 750 million monthly active users. Newer AI labs cannot match that volume of real human interaction data through synthetic data or research alone.
3. Custom Compute Economics
Controlling the full stack lowers Alphabet’s AI costs. Running workloads on custom TPUs rather than relying strictly on Nvidia GPUs keeps their cost per unit of compute below market rates. Selling these TPU systems directly to enterprise clients shows that their proprietary hardware competes head-to-head with standard market chips.
4. Enterprise Cloud Stickiness
Google Cloud combines standard enterprise switching cost, like data migration and workflow setup, with AI ecosystem lock-in. Once a company builds applications on specific models and hardware architectures, changing providers becomes expensive and messy. Google Cloud remains smaller than AWS and Azure, but it continues to grow faster than both.
Evidence of the Moat
The financial numbers back this up. Google Services expanded its operating margin from 38.7% to 40.4% between 2021 and 2025, even as the segment matured and Alphabet invested heavily in AI development.
Google Cloud offers an even clearer proof point, showing a moat being built in real time. The segment swung from a $3.1 billion operating loss in 2021 to a $13.9 billion profit in 2025, marking a $17 billion turnaround in four years.
Competitive Landscape
Alphabet operates across four primary competitive arenas, each defined by distinct market dynamics. In digital advertising, the company faces strong competition from Meta, Amazon, retail media networks, and connected TV platforms; however, none match Google’s combination of commercial intent data and native platform distribution. In cloud computing, Google Cloud functions within a three-horse market alongside Amazon Web Services and Microsoft Azure where, despite remaining the smallest of the three in absolute dollar terms, it continues to capture market share by outgrowing the broader industry. Within frontier AI models, Google DeepMind navigates a rapidly shifting landscape alongside OpenAI, Anthropic, and Meta, standing out by pairing its model research directly with proprietary hardware infrastructure and immediate global distribution. Finally, in autonomous mobility, Waymo competes against Tesla, Zoox, and Cruise, maintaining a clear lead in actual driverless commercial miles while testing its sensor-heavy hardware architecture against Tesla’s vision-only approach.
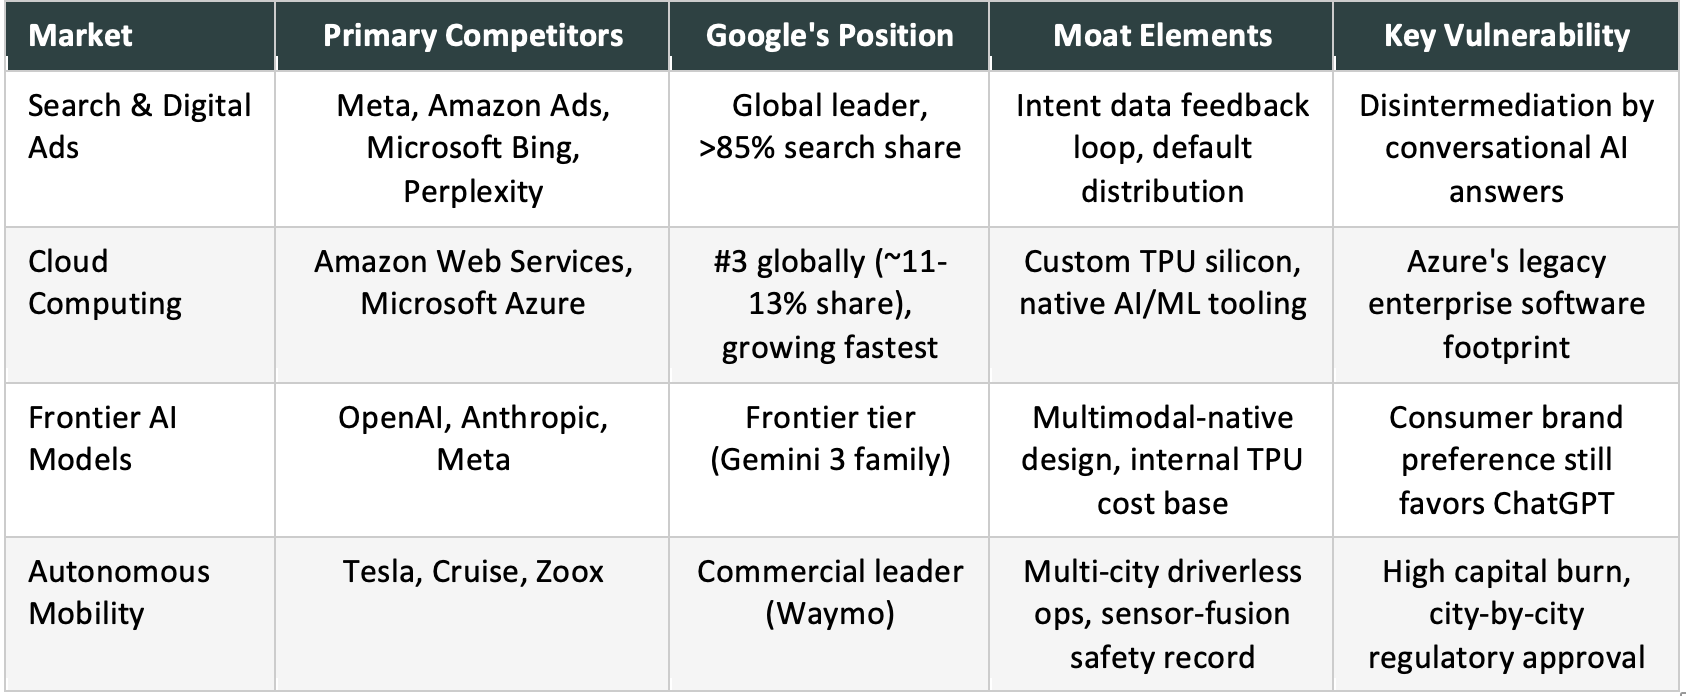
The key takeaway is structural. Very few companies own proprietary distribution, custom compute silicon, and a top-tier AI lab simultaneously. Replicating that full-stack position requires decades of capital and scale.
The Inference Cost Curve, and Why It Favors Alphabet
An underappreciated structural trend working in Alphabet’s AI strategy is the dramatic drop in model execution costs. Inference prices, defined as the compute cost required to generate a response, have collapsed faster than historical chip cost curves.
In 2021 and 2022, output matching GPT 3 performance cost roughly $20 per million tokens. By late 2024, an equivalent small model cost as little as $0.07 per million tokens, representing a 280x reduction in under two years. Frontier models followed the same path. GPT 4 class output launched at $30 to $60 per million tokens in early 2023. By 2025 and 2026, models at or above that capability level priced between $0.50 and $5.00 per million tokens.
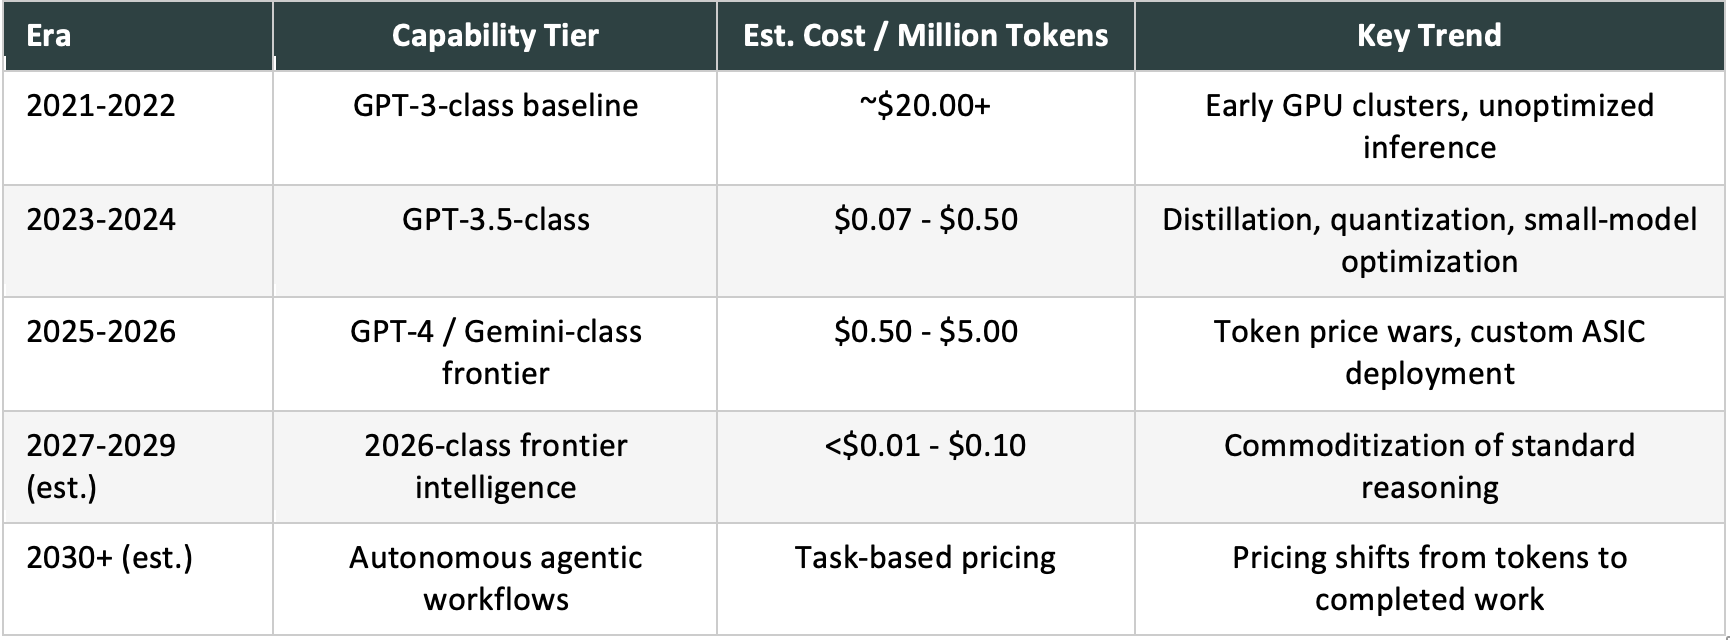
Falling model costs impact Alphabet in several concrete ways.
First, it eliminates what was Search’s biggest threat two years ago; the compute expense of AI answers. Generative responses cost far more than traditional indexed queries. Had inference costs not collapsed, rolling out AI Overviews across trillions of searches annually would have squeezed Search margins.
Second, cheaper inference expands the Cloud market instead of shrinking it. As compute gets cheaper, enterprises run significantly more of it, the classic rebound effect known as Jevons paradox. This dynamic explains why Google Cloud’s API volume and contracted backlog continue to accelerate.
Third, In-house TPUs bypass third-party chip markups, letting Alphabet’s internal cost per token fall faster than market rates. That gives them room to price Cloud aggressively while maintaining margins that GPU-dependent competitors can’t match.
Finally, lower unit costs allow Alphabet to bundle Gemini features into existing Workspace subscriptions at negligible incremental cost, while offloading routine processing directly to Pixel phones via Gemini Nano to cut cloud compute expenses entirely. Falling AI costs hurt companies that merely resell third-party compute, but they reinforce companies that own the entire stack.
3. Financial Performance
Revenue Growth
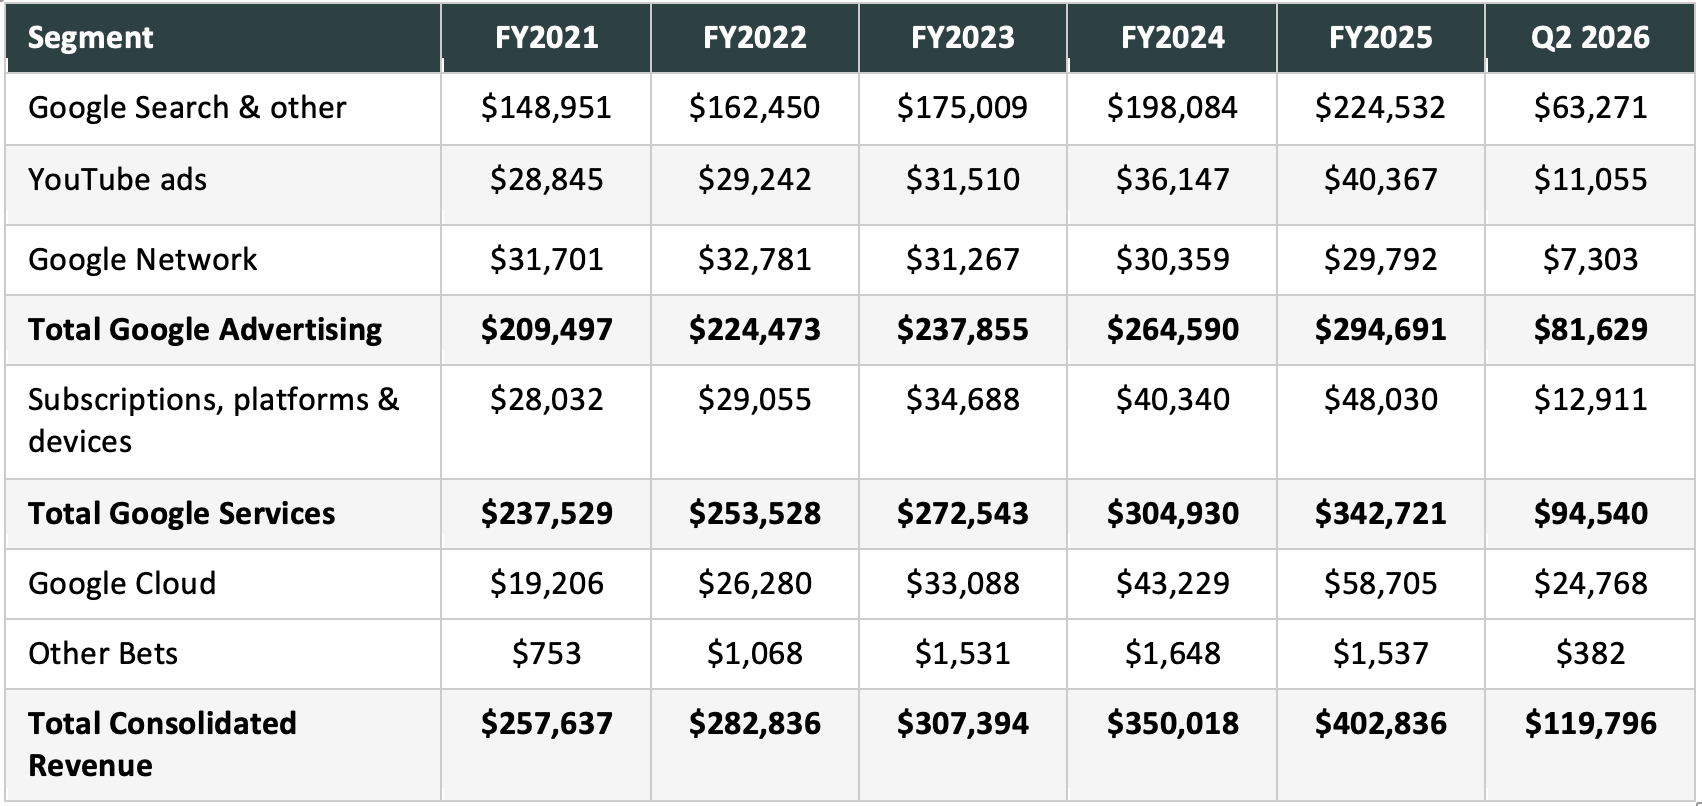
Alphabet expanded revenue from $257.6 billion in 2021 to $402.8 billion in 2025, compounding at roughly 12% annually. That trajectory included a noticeable dip and recovery. Growth slowed to 9.8% in 2022 and 8.7% in 2023 during an ad market slowdown, before picking back up to 13.9% in 2024 and 15.1% in 2025 as Google Cloud and AI features gained momentum.
After crossing $400 billion for the full year in 2025, top-line growth accelerated further in Q2 2026, reaching $119.8 billion (up 24.2% year over year). That marked Alphabet’s twelfth straight quarter of double-digit revenue growth.
The segment breakdown highlights where that top-line expansion originated. Google Cloud compounded at roughly 32% annually from 2021 through 2025. Google Subscriptions, platforms, and devices grew at nearly 15% annually over the same stretch, while Google Search remained the largest revenue driver, compounding at roughly 11%.
Google Network, covering third-party site and app advertising, was the sole line item to shrink in absolute terms. After peaking in 2022, Network revenue dropped each subsequent year as ad spend shifted toward Alphabet’s owned-and-operated properties.
Sub-Segment Detail: Google Services
Google Search remains the anchor of the overall business, generating $224.5 billion in FY2025, or 55.7% of consolidated revenue, up from $149.0 billion (57.8%) in FY2021. Growth slowed to 9.1% in 2022 during an advertiser pull-back against tough pandemic comparisons, before accelerating to 13.2% in both 2024 and 2025 as commercial queries rebounded and monetization of AI Overviews and Circle to Search kicked in. Search revenue reached $63.3 billion in Q2 2026, up 16.8% year over year, offering clear evidence that generative search features expand total search activity without cannibalizing ad inventory.
YouTube advertising grew from $28.8 billion in 2021 to $40.4 billion in 2025. Growth flattened to 1.4% in 2022 amid competition from TikTok and broader market weakness, before rebounding as Shorts monetization scaled and direct-response formats matured. YouTube ad revenue grew 11.7% in 2025 and hit $11.1 billion in Q2 2026 (up 12.9% year over year), supported by connected-TV viewing and live sports. Including subscription revenue across Premium, Music, and TV, the broader YouTube property reached an annualized run rate above $60 billion by late 2025.
Google Network, covering ads placed on third-party sites via AdSense and Ad Manager, is the one segment experiencing a steady decline. Revenue dropped from a peak of $32.8 billion in 2022 to $29.8 billion in 2025, reaching $7.3 billion in Q2 2026, where growth was essentially flat year over year. Its share of total revenue fell from 12.3% in 2021 to 7.4% in 2025. This reflects industry-wide shifts like third-party cookie deprecation and ad dollars moving to retail media and owned platforms.
Subscriptions, platforms, and devices, including YouTube paid tiers, Google One, Play Store fees, and Pixel hardware, remains the fastest-growing line inside Google Services. Revenue grew from $28.0 billion in 2021 to $48.0 billion in 2025 (up 19.1% in 2025 alone) and hit $12.9 billion in Q2 2026. Paid subscriptions across YouTube and Google One passed 325 million at year-end 2025 and reached roughly 350 million in Q1 2026. This recurring revenue stream addresses long-standing concerns around total reliance on advertising cycles.
Sub-Segment Detail: Google Cloud
Google Cloud grew from $19.2 billion in 2021 to $58.7 billion in 2025, lifting its share of total revenue from 7.5% to 14.6%. Top-line growth in Cloud continues to gain momentum. Revenue accelerated to $24.8 billion in Q2 2026, up 81.8% year over year, pushing the segment to 20.7% of Alphabet’s quarterly revenue.
Growth was driven across custom TPU v6 (Trillium) clusters, Nvidia GPU capacity, Gemini Enterprise API adoption, and Workspace AI add-ons. Contracted backlog, representing unearned revenue under contract, nearly doubled from roughly $242.8 billion at the end of 2025 to over $460 billion in early 2026, reaching $514 billion by the end of Q2. That expansion shows long-term enterprise commitments actively converting into recognized revenue.
Sub-Segment Detail: Other Bets
Other Bets, which includes Waymo, Verily, Calico, Wing, and Alphabet’s venture arms, grew from $753 million in 2021 to a peak of $1.65 billion in 2024, before edging down to $1.54 billion in 2025. The segment generated $382 million in Q2 2026. Revenue comes primarily from Waymo ride-hailing fares and Verily health research deals. This section currently acts as a drag on overall cash flow. While these ventures could become meaningful income sources in the future, significant contribution remains unlikely in the near term.
Profitability
Consolidated operating margin rose from 30.5% in 2021 to 32.0% in 2025. Margins bottomed at 26.5% in 2022 during the broader tech slowdown before rebounding as Alphabet slowed hiring, cut costs, and gained operating leverage in its growth segments, reaching 34.0% in Q2 2026.
That overall number masks much stronger profitability at the segment level. Google Services expanded its operating margin from 38.7% to 40.4% over the period. The primary driver of consolidated margin expansion was Google Cloud, which swung from an operating loss of $3.1 billion (-16.1% margin) in 2021 to an operating profit of $13.9 billion (23.7% margin) in 2025, expanding further to 35.6% in Q2 2026.
Consolidated margins grew slower than both individual segments due to unallocated corporate expenses. Unallocated costs, driven primarily by central AI research for Gemini along with legal fines and corporate overhead, increased from $4.8 billion in 2021 to $15.8 billion in 2025, reaching $5.8 billion in Q2 2026 alone.
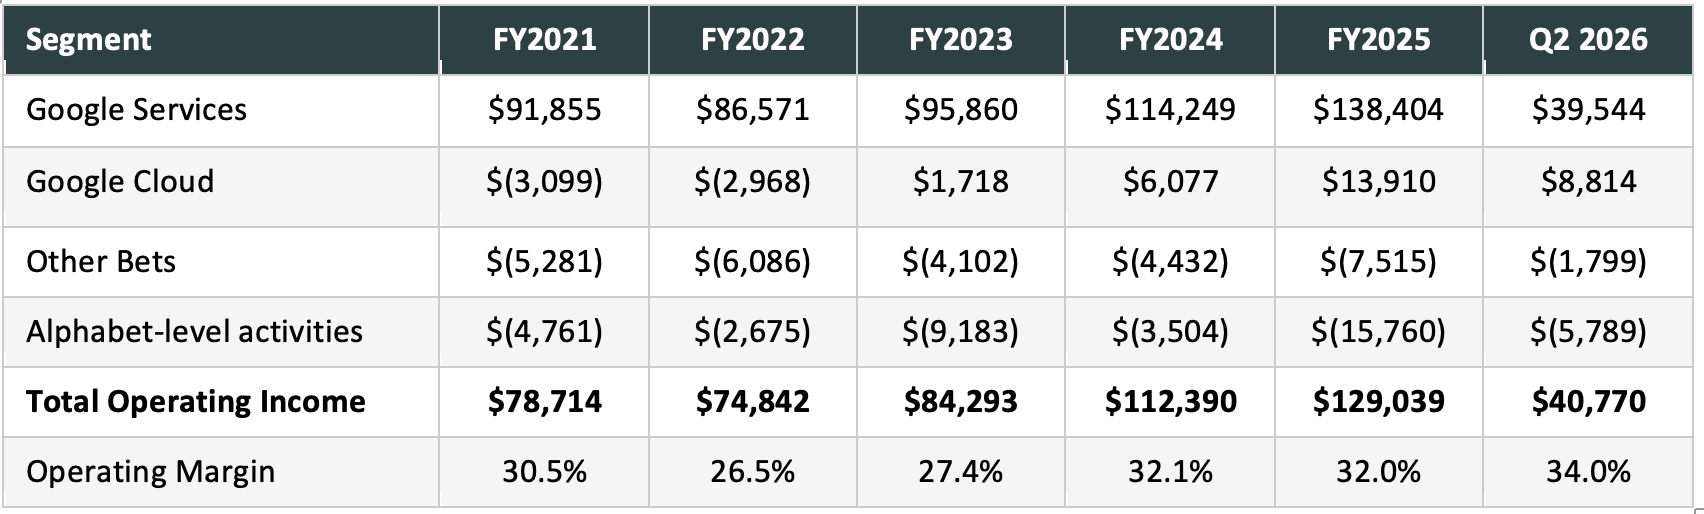
Google Cloud went from a $3.1 billion operating loss in 2021 to $8.8 billion in operating profit in Q2 2026 alone, with margins reaching 35.6%. That shift reflects how quickly earnings compound once cloud infrastructure utilization passes its fixed-cost base. Other Bets presents the opposite dynamic, posting cumulative operating losses of roughly $27.4 billion from FY2021 through FY2025. This includes a $7.5 billion loss in 2025, which contained a $2.1 billion stock-based compensation charge related to Waymo equity units.
Net income increased from $76.0 billion in 2021 to $132.2 billion in 2025, with diluted EPS rising from $5.61 to $10.81 (an ~18% CAGR), supported by share repurchases that reduced diluted share count from 13.55 billion to 12.23 billion. However, FY2025 net income includes approximately $24 billion in unrealized gains on equity investments, primarily Alphabet’s stake in SpaceX. Excluding these non-recurring gains provides a clearer baseline, with adjusted EPS growing from $4.87 to $9.16 over the period, representing a ~17% compound annual rate.
Free Cash Flow
Free cash flow grew from $67.0 billion in 2021 to $73.3 billion in 2025, compounding at roughly 2% annually. This lags behind operating income (13% CAGR) and diluted EPS (18% CAGR) over the same timeframe.
This divergence stems from reinvestment instead of weakening cash generation. Operating cash flow grew from $91.7 billion to $164.7 billion over those four years, outpacing revenue growth. The gap reflects increased capital expenditure, which expanded from $24.6 billion in 2021 to $91.4 billion in 2025 to build data centers and TPU infrastructure ahead of expanding Cloud backlog demand. Consequently, capex absorbed 56% of operating cash flow in 2025, up from 27% in 2021, marking an intensive capital cycle.
Return on Invested Capital
ROIC declined from 35.5% in 2021 to 29.8% in 2025. That drop reflects a capital base expanding ahead of near-term operating income, as massive AI infrastructure investments hit the balance sheet prior to full monetization.
Despite compressed returns, profitability remains exceptionally strong. Even with the compressed return profile, Alphabet’s ROIC sits comfortably above its cost of capital.
Balance Sheet
Alphabet’s balance sheet has expanded, but leverage remains conservative. Total debt and lease obligations rose from $26.2 billion in 2021 to $59.3 billion in 2025, bringing debt-to-equity from 0.11 to 0.14. Cash, cash equivalents, and marketable securities fell slightly from $139.6 billion to $126.8 billion over the same period. Rather than accumulating idle cash, management directed capital back into data center investments, share repurchases, and dividends.
Debt issuance and asset expansion continued into 2026. Long-term debt reached roughly $77.5 billion by the end of Q2 2026, up from $46.5 billion at year-end 2025. Over the same stretch, net property and equipment grew from $246.6 billion to $281.0 billion, capturing the ongoing infrastructure buildout in real time.
Capital Expenditure
Capital expenditure is the primary variable underpinning free cash flow trends, ROIC, and overall risk profile. Viewing capex relative to revenue, provides a clearer picture of whether infrastructure investments are growing in line with top-line expansion or outpacing it.
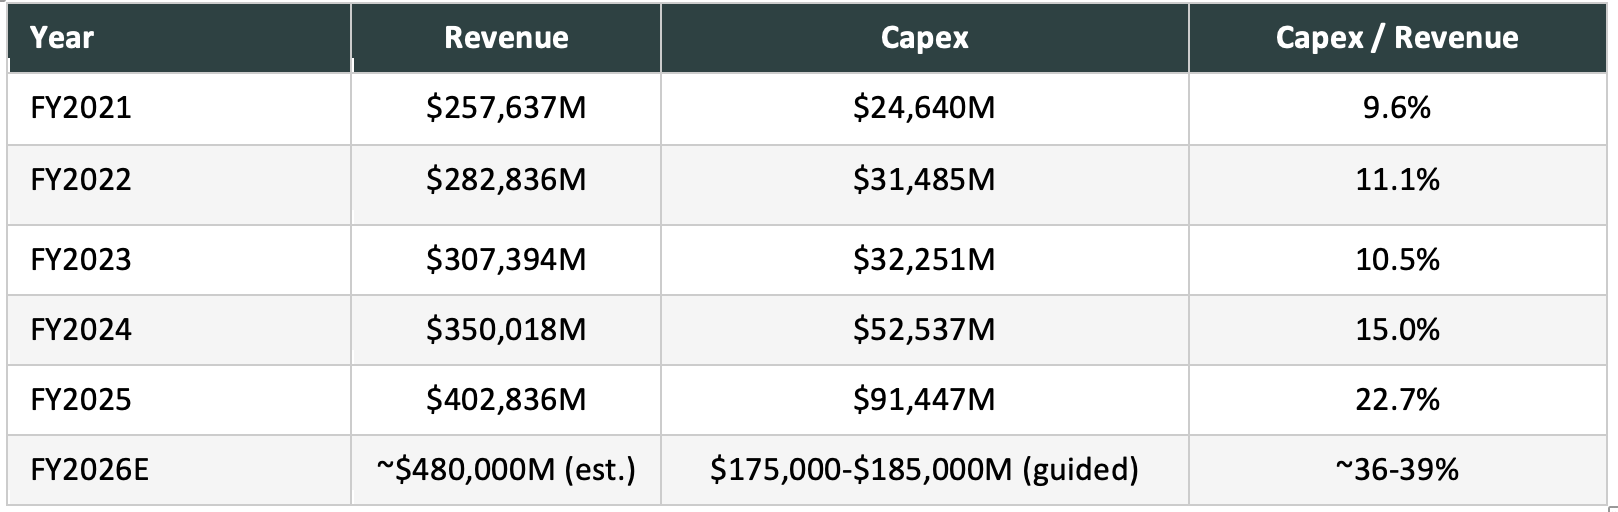
Between 2021 and 2023, capex stayed within a narrow range of 9.6% to 11.1% of revenue. It broke out of that range in 2024 and 2025. Based on management’s 2026 guidance, capital intensity could approach the high 30s as a percentage of revenue, an unprecedented level for Alphabet. This reflects a structural increase in capital intensity: Alphabet is committing a significantly higher share of every incremental revenue dollar to infrastructure than it did historically.
The bulk of this outlay represents growth capital, land acquisition, data center construction, and custom TPU manufacturing capacity, backed by expanding Cloud backlog demand. Section 7 covers key metrics to monitor for signs of overbuild and evaluates potential outcomes if capital outlay stays ahead of revenue realization longer than anticipated.
4. Growth Levers & Addressable Market
A) Google Cloud and the Enterprise AI Buildout
Google Cloud’s transition from a distant third player to a peer alongside AWS and Azure represents its largest growth lever. With over 90% of Fortune 100 companies using Alphabet’s enterprise AI tools, near-term expansion relies primarily on increasing spend within existing accounts instead of acquiring new logos from scratch.
Monetization spans three product layers, each carrying a distinct margin profile:
Infrastructure Layer: Raw TPU and GPU compute consumption for training and running proprietary models.
Platform Layer (Vertex AI): Token- or query-based pricing for model fine-tuning, RAG pipelines, and agent workflows.
Application Layer (Workspace): Per-user monthly subscriptions for AI add-ons integrated into Docs, Sheets, Gmail, and Meet.
Offering all three tiers allows Alphabet to capture value across different enterprise consumption models without relying on a single pricing structure.
B) TPU Systems as a Standalone Product Line
Alphabet began selling TPU hardware systems directly to external enterprise customers in 2026, introducing a new revenue stream to its financial statements. This direct hardware sales model adds incremental revenue on top of the existing cloud-hosted rental offering. More importantly, selling systems externally validates that Alphabet’s custom silicon competes directly with merchant GPUs on price and performance, instead of serving solely as an internal cost-saving measure. If direct hardware sales scale at a pace similar to the TPU rental business, it becomes a meaningful, high-margin complement to Alphabet’s core Cloud business
C) Subscriptions, Platforms, and Devices
The non-advertising bundle represents the fastest-growing component inside Google Services. This includes YouTube paid tiers, Google One (which bundles access to Gemini models), Google Play, and Pixel hardware. The segment grew 71% between 2021 and 2025, expanding from $28.0 billion to $48.0 billion, more than doubling the growth rate of advertising over the same stretch. Its share of Google Services revenue rose from 11.8% to 14.0%, providing a sticky, recurring revenue stream that compounds faster than core ad inventory.
Growth across these product lines relies on leveraging existing distribution instead of building channels from scratch. For instance, Google One evolved from basic cloud storage into the main consumer gateway for premium Gemini access, while YouTube Premium and YouTube TV use live sports rights like NFL Sunday Ticket to drive initial subscriber acquisition across the broader ecosystem.
D) Search Query Expansion Through Generative Formats
A primary concern regarding AI Overviews and AI Mode was that synthesized answers would eliminate organic clicks and ad monetization. In practice, generative formats encourage longer, multi-step queries—such as planning complex travel itineraries or evaluating financing options—that traditional keyword search was not built to support. These longer prompts introduce new commercial touchpoints, embedding product comparisons, booking links, and sponsored recommendations directly within the generated response. This expansion in query complexity underpins Search’s 16.8% revenue growth in Q2 2026; user queries are becoming commercially richer.
E) Other Bets and the Waymo Option
Other Bets remains small in total top-line terms, generating $1.5 billion in 2025 revenue against $402.8 billion consolidated, and represents an ongoing cash draw, with operating losses widening from $4.1 billion to $7.5 billion over four years. Revenue roughly doubled over the same timeframe, driven primarily by Waymo’s expansion of commercial robotaxi operations across markets like Phoenix, San Francisco, Los Angeles, and Austin.
Waymo completes hundreds of thousands of paid weekly trips and leverages a partnership with Uber to access established dispatch demand without replicating ride-hailing distribution infrastructure. Private funding rounds value Waymo in the tens of billions of dollars, positioning Other Bets as a funded long-term option on autonomous mobility despite near-term operating drag and an unannounced path to profitability.
What the TAM Picture Tells Us
Alphabet’s core markets, digital advertising and public cloud infrastructure, remain massive and continue to grow at double-digit rates. Global digital ad spending grew from $375 to $400 billion in 2020 to an estimated $570 to $650 billion in 2025, with industry projections pointing to $1.2 to $1.5 trillion by 2031. Public cloud expanded even faster, rising from $310 to $350 billion in 2020 to roughly $1.29 trillion today, with forecasts reaching $2.28 trillion by 2030 or 2031. Adding consumer subscriptions and streaming (~$150 billion today expanding toward $350 billion) alongside autonomous mobility (~$15 billion today compounding above 30% annually toward $120+ billion), Alphabet’s combined addressable market exceeds $2 trillion today and could reach roughly double that over the next decade. While third-party market-size estimates carry inherent variance, even conservative figures indicate that a company generating $402.8 billion in revenue maintains substantial market runway.
5. Management
Leadership and Tenure
Sundar Pichai has led Google since 2015 and Alphabet since 2019, having joined the company in 2004 and advanced through leadership roles in Chrome and Android. His tenure spans three major technological transitions, mobile, cloud, and artificial intelligence, each of which expanded Alphabet’s addressable opportunities. Executive leadership transitioned in 2024 when long-time CFO Ruth Porat shifted to President and Chief Investment Officer, with Anat Ashkenazi stepping in as CFO to manage the current capital allocation and financing programs.
Skin in the Game
Co-founders Larry Page and Sergey Brin retain majority voting control through supervoting Class B shares while holding a smaller percentage of total equity. Established at the 2004 IPO, this dual-class ownership structure insulates executive management from short-term market fluctuations and activist pressure. While this voting power supports long-term infrastructure planning, it limits minority shareholder influence over major strategic initiatives, including capital expenditure targets.
Capital Allocation Track Record
Alphabet’s capital allocation strategy shifted meaningfully between 2024 and 2026. Share repurchases peaked at $62.2 billion in 2024 before scaling back to $45.7 billion in 2025, with no buybacks executed during the first half of 2026 as operating cash was reprioritized toward infrastructure development. Alongside share repurchases, Alphabet introduced a quarterly dividend in 2024 and increased it twice, bringing the payout to $0.22 per share quarterly.
To fund its expanded capital plan, Alphabet raised approximately $49.6 billion in external capital during Q2 2026 across debt, equity, preferred stock, and private placements. This active external financing marks a departure from a long-standing reliance on internal cash generation to fund growth, reflecting the massive capital requirements of the current AI infrastructure investment cycle.
6. Valuation
Growth Engines
The future return on Alphabet stock is a function of two engines; the future growth in free cash flow per share and any valuation re-rating. Both are explained below:
Engine 1: Fundamentals
The first engine is the business itself. FCF per share grows over time through revenue expansion, operating leverage, and share count reduction from buybacks. That growth, compounded annually, is what the fundamental engine delivers regardless of any valuation re-rating.
For Alphabet, I assume a FCF per share growth over the projection period, from the roughly 5% pace of the last four years toward something closer to the high teens, in line with normalized earnings growth. The primary driver is Google Cloud’s continued march toward Amazon Web Services and Microsoft Azure-level margins which are currently above 30%, still expanding from 23.7% today, compounding on top of the Search business that keeps growing revenue faster than click volume as monetization per click improves.
Margin recovery at the consolidated level is the second component of this growth rate; as the current AI infrastructure buildout matures and depreciation growth normalizes relative to revenue, operating leverage should reassert itself the way it already has inside Google Services and Cloud individually. Buybacks add a further per-share amplification effect once they resume at scale, diluted share count has already fallen from 13.55 billion to 12.23 billion over the past four years, even through a period where repurchases were curtailed to help fund the current capex program.
I also expect free cash flow conversion to improve as the current elevated capital expenditure cycle cools. The data center and TPU manufacturing buildout behind the 2025 and 2026 capex figures is a maturing, finite investment program built to capture a specific, already-contracted Cloud backlog, not a permanent step-up in the business’s capital intensity. As that backlog gets built out and capacity catches up with the demand behind it, capex should normalize back toward a lower share of revenue, and a larger share of operating cash flow should convert directly to free cash flow without a corresponding reinvestment offset, a tailwind to the fundamental engine on top of the growth rate assumption itself.
Engine 2: Valuation Re-Rating
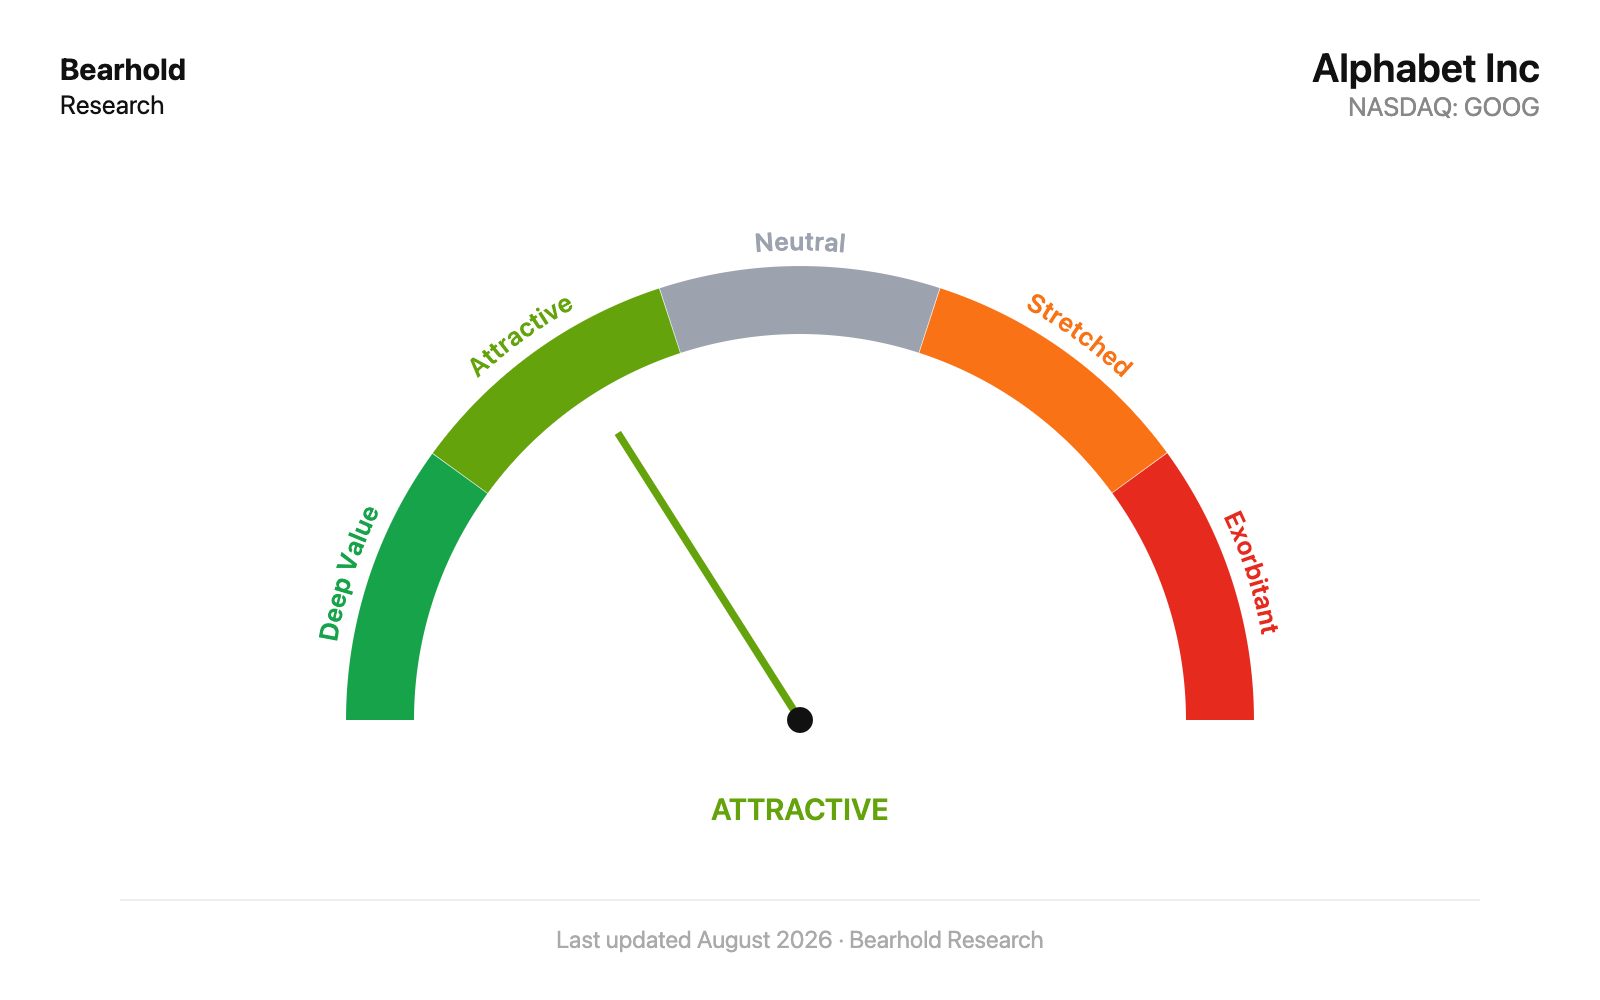
At today’s price of approximately $355, the investor is paying for everything this business will earn over roughly the next 18 years, in today’s money. Everything it earns beyond that point comes to the investor at no additional cost. The fewer the embedded years, the more of the future the investor receives without paying for it.
At 18 embedded years, the price sits in the Attractive zone on my own valuation scale. This is a price still shaped by lingering doubts about whether generative AI erodes Search’s economics and how the current capital spending cycle plays out, both of which I addressed in the Financial Performance and Risks sections.
At 18 embedded years, I believe both engines are working in the investor’s favor here; a genuinely growing free cash flow base compounding through Cloud’s margin inflection and Search’s continued monetization gains, and a valuation that still has room to re-rate.
Hold, Add, and Exit Logic
This framework isn’t a mechanical buy-and-sell signal, it’s a way of thinking about price relative to value. In the Deep Value and Attractive zones, the price is working in the investor’s favor, more future cash flow is embedded per dollar paid than the market typically offers for a business of this quality. The Neutral zone reflects fair valuation, whereas the Stretched and Exorbitant zones embed high optimism with little to no margin for error. My own approach is to sell when a position moves into Stretched or exorbitant territory and reallocate to names sitting in the Deep Value or Attractive zones elsewhere in the portfolio; holding an expensive position when an attractive alternative exists is an opportunity cost that compounds against you.
7. Risks
AI-Native Search Disruption
This represents the primary risk facing Alphabet and receives the greatest market attention. If conversational AI interfaces replace traditional search faster than Alphabet’s own AI offerings capture the transition, both query volume and unit query value across its largest, highest-margin segment risk erosion. Beyond demand, a fundamental cost dynamic exists: traditional keyword queries rely on indexed database lookups—low-cost and fast—whereas generative answers require real-time neural network inference across large language models, carrying higher compute and electricity costs per query. If AI-format ad monetization fails to keep pace with the higher compute expense required to serve these queries, Search margins face structural compression even if overall query volume remains stable.
There are two potential trajectories for Search monetization from here. In the primary scenario, AI Overviews and conversational formats serve as a richer front end to the auction-based ad model, where complex queries unlock additional commercial touchpoints and Search continues compounding in line with recent trends. In the alternative scenario, users transition to standalone AI assistants outside Google’s ecosystem, compressing both query volume and per-query monetization.
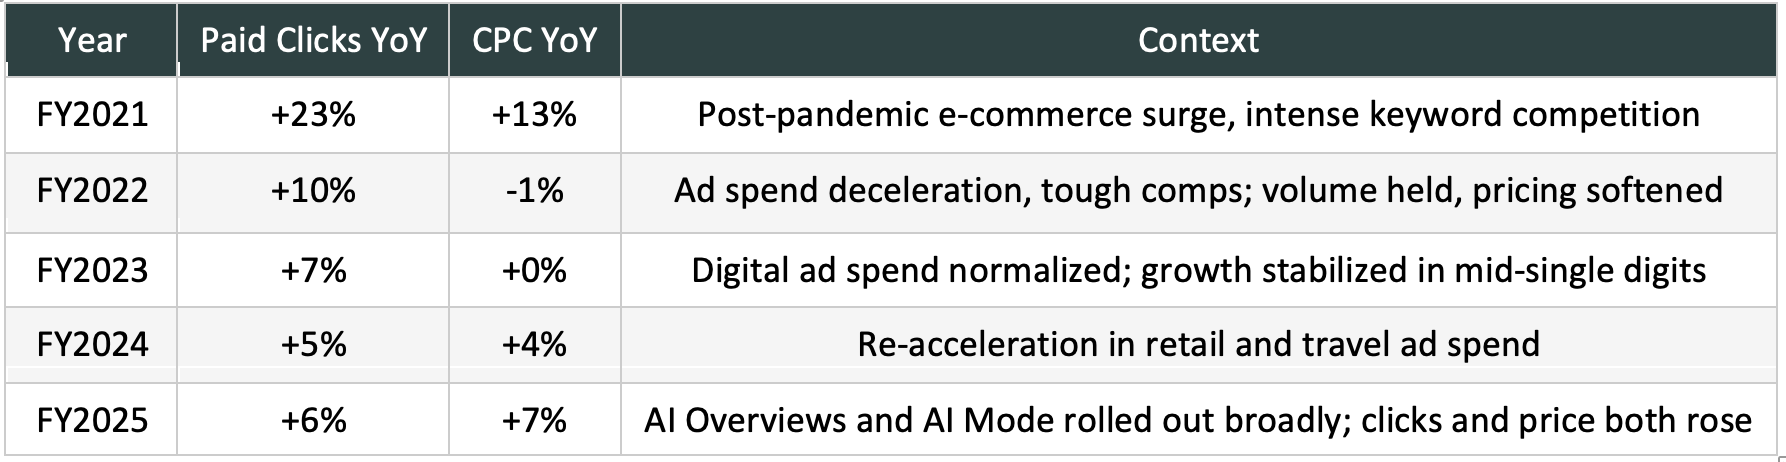
Historical disclosures support the first outcome. While paid click growth decelerated from a post-pandemic peak of 23% in 2021 to single digits annually, Search revenue continued to compound at 10% to 15% per year over the same period. This disconnect demonstrates that revenue growth has decoupled from raw click volume, driven instead by rising cost-per-click and improved monetization efficiency through ad tech enhancements like Performance Max. This shift reflects an expansion in query quality and value capture rather than a maturing market.
Antitrust and Regulatory Overhang
Alphabet faces substantial ongoing regulatory pressure across multiple jurisdictions. In Europe, the company has paid or accrued billions of dollars in fines covering Android, AdSense for Search, and AdTech self-preferencing. In the US, Alphabet remains subject to Search antitrust remedies currently under appeal, alongside a pending Department of Justice AdTech lawsuit where proposed remedies include the divestiture of publisher ad-server and supply-side exchange assets (Google Ad Manager and AdX). Company disclosures indicate a forced divestiture could materially impact Google Network, a third-party advertising segment that is already contracting organically. Additionally, the EU’s Digital Markets Act and Digital Services Act enforce operational constraints, including user data combination restrictions and self-preferencing bans in search results, that increase compliance overhead and limit product integration flexibility.
None of the regulatory matters resolved to date have altered Alphabet’s underlying competitive moats. Historical settlements and rulings have resulted in financial penalties, mandated data-sharing provisions, and adjustments to distribution agreements, shifting from exclusive default placements toward user-choice frameworks, without impairing the core ability to monetize distribution networks, infrastructure, or platform ecosystem stickiness.
However, the multi-year sequence of adverse or partially adverse regulatory outcomes across global jurisdictions warrants monitoring. The pending decision regarding US AdTech remedies is particularly material, as a potential structural divestiture could impact Google Network’s economic model in a manner distinct from previously settled cases.
Whether the AI Capital Expenditure Pays Off
This risk links all core investment variables together, functioning primarily as a question of capital timing; whether $175 billion to $185 billion in projected 2026 capex, partially funded via external capital, can generate returns before depreciation schedules and financing expenses accumulate.
This capital deployment trajectory breaks down into three potential scenarios:
Extended Return Compression (Primary Scenario): Data centers and compute hardware depreciate over short timeframes, whereas enterprise software monetization typically requires five to seven years to reach scale. If physical infrastructure expansion outpaces revenue conversion, consolidated margins experience temporary pressure while core profitability remains intact.
Standard Timeline Alignment: Cloud contracted backlogs convert into recurring revenue at current paces, declining inference costs drive API adoption, and infrastructure generates returns above cost of capital without extended margin drag.
Overcapacity Misallocation (Low-Probability Scenario): Infrastructure is deployed significantly ahead of end-market demand. Unlike speculative past infrastructure cycles, current capex is backed by existing revenue expansion, including 82% Cloud revenue growth, expanded subscription tiers, and continued Search compounding.
What tips the outcome one way or the other comes down to three variables:
Monetization lag: the industry-wide gap between how fast hyperscalers are building infrastructure and how fast enterprises are actually paying for AI software seats.
Hardware depreciation pace: AI accelerator chips turn over roughly every 12 to 18 months, which could force faster write-downs on what’s being built today.
Power and grid constraints: rising electricity costs and grid bottlenecks raise the ongoing cost of running these clusters, on top of the upfront capital.
Alphabet retains specific structural mitigations against these pressures. Unutilized compute capacity can be redirected internally toward Search ranking, YouTube recommendations, Waymo driving models, and DeepMind research. In addition, proprietary custom silicon (Trillium TPUs) maintains lower compute costs per unit compared to purchasing merchant GPUs at supplier markups.
To manage physical power constraints, Alphabet has secured over 240 clean energy contracts representing nearly 35 gigawatts globally, signed long-term power agreements covering nuclear (Kairos Power) and geothermal energy (Fervo Energy), acquired Intersect Power for $4.75 billion to co-locate power generation directly with data centers, and maintained dual-sourcing across custom TPUs and Nvidia GPUs. Consequently, temporary margin compression from overinvestment represents a manageable cost, whereas underinvesting risks ceding market position in Cloud and AI-native Search to better-capitalized competitors.
8. Thesis Breakers
Primary operational and structural metrics indicating potential thesis invalidation break down across four core categories:
Search and Advertising Key risks include traffic acquisition costs growing meaningfully faster than Google Advertising revenue, a signal that Alphabet is overpaying to preserve default distribution as organic user preference weakens. Additionally, cost-per-click or click-through rates on AI Overviews falling noticeably below traditional search formats would indicate that synthesized answers fulfill user intent without driving monetizable ad interactions. Finally, Search revenue decelerating into low single digits alongside continued market share gains by alternative search tools like ChatGPT Search or Perplexity would point to structural user migration rather than initial experimentation.
Cloud and AI Infrastructure For the Cloud segment, a thesis breaker includes a sequential contraction in contracted backlog, reversing the steady expansion trajectory built through 2025 and 2026. Furthermore, Google Cloud’s operating margin retreating back toward single digits or low teens after reaching the mid-30s would signal a competitive price war eroding segment profitability. Lastly, a decline in developer API usage from current baselines would indicate enterprise workloads actively migrating to alternative foundation model platforms.
Capital Efficiency Capital efficiency metrics to watch center on free cash flow turning negative, or capital expenditures consistently consuming more than 70% to 80% of operating cash flow for consecutive quarters. A scenario where depreciation and amortization grow faster than total revenue over an extended period would indicate that underlying physical infrastructure is aging or becoming obsolete faster than software-layer monetization can offset it. Finally, a sustained, multi-quarter decline in consolidated ROIC beyond expected near-term compression would signal inefficient capital deployment.
Distribution and Regulation On the distribution and regulatory front, a key trigger would be a material loss in Chrome or Android market share to competing web browsers, operating systems, or emerging AI-native hardware form factors. Structurally, a final judicial ruling mandating a breakup of Google’s adtech ecosystem, or prohibiting core distribution agreements that secure Google as the default search provider without an effective operational alternative, would directly impair monetization reach.
The author does not hold a position in Alphabet, Inc. at the time of publication. This report reflects the author’s personal views and is not investment advice. Investing carries the risk of permanent capital loss. Read full disclosure here.