



When I evaluate Microsoft Corporation today, I see an enterprise undergoing one of the most significant physical and operational transformations in corporate history. Over the past thirteen years, under the leadership of Chairman and CEO Satya Nadella, Microsoft has systematically transformed itself from an asset-light enterprise software provider into a global, capital-intensive hyperscale digital infrastructure operator. While this transition initially centered on migrating enterprise workloads to cloud infrastructure, the commercialization of foundation models and generative artificial intelligence has escalated this strategy into an intense physical infrastructure expansion.
The primary story, and the central analytical challenge, is the unprecedented surge in capital expenditures (CapEx) and the structural re-architecting of the company’s balance sheet and cash flow statement. Between fiscal years 2014 and 2026, Microsoft’s annual cash additions to property, plant, and equipment expanded from $5.49 billion, representing a modest 6.3% of revenue, to an astounding $115.90 billion, absorbing 34.9% of total consolidated sales.
This capital supercycle fundamentally alters Microsoft’s corporate finance profile and raises several critical questions for long-term equity valuation.
First, a significant structural shift has occurred in asset composition, with capital outlays pivoting away from long-lived real estate toward short-lived, high-density compute hardware such as graphics processing units (GPUs) and custom application-specific silicon.
Second, a major portion of what is currently categorized as “Growth CapEx” carries a hidden recurring maintenance burden, as fast-moving silicon wears out or becomes economically obsolete every three to four years. Consequently, growth spending today will permanently convert into a high recurring Maintenance CapEx floor in the future.
Third, management’s accounting policy choices, such as extending server useful lives from four to six years in FY2023, serve as near-term earnings-smoothing mechanisms that cushion operating margins without altering underlying cash commitments.
Ultimately, I believe this structural shift permanently resets Microsoft’s steady-state cash flow conversion profile. Over the next decade, as physical datacenter buildouts normalize, I project that CapEx as a percentage of revenue will settle into a new baseline of 20% to 25%, roughly double its historical pre-AI baseline. As a direct result, Free Cash Flow (FCF) margins will permanently adjust from historical levels of 30% to 33% down to a new equilibrium of 20% to 25%.
Equity valuation models must therefore price in a permanently higher capital reinvestment hurdle as the necessary cost of maintaining market leadership in enterprise cloud and artificial intelligence infrastructure.
The author does not hold a position in Microsoft, Inc. at the time of publication. This report reflects the author’s personal views and is not investment advice. Investing carries the risk of permanent capital loss. Read full disclosure here.
1- Business Architecture, Monetization Mechanics, and Operational Scale Evolution
To understand why Microsoft is deploying hundreds of billions of dollars into physical infrastructure, we must first examine how its business model is structured, how it extracts commercial value, and how its operational footprint has evolved.
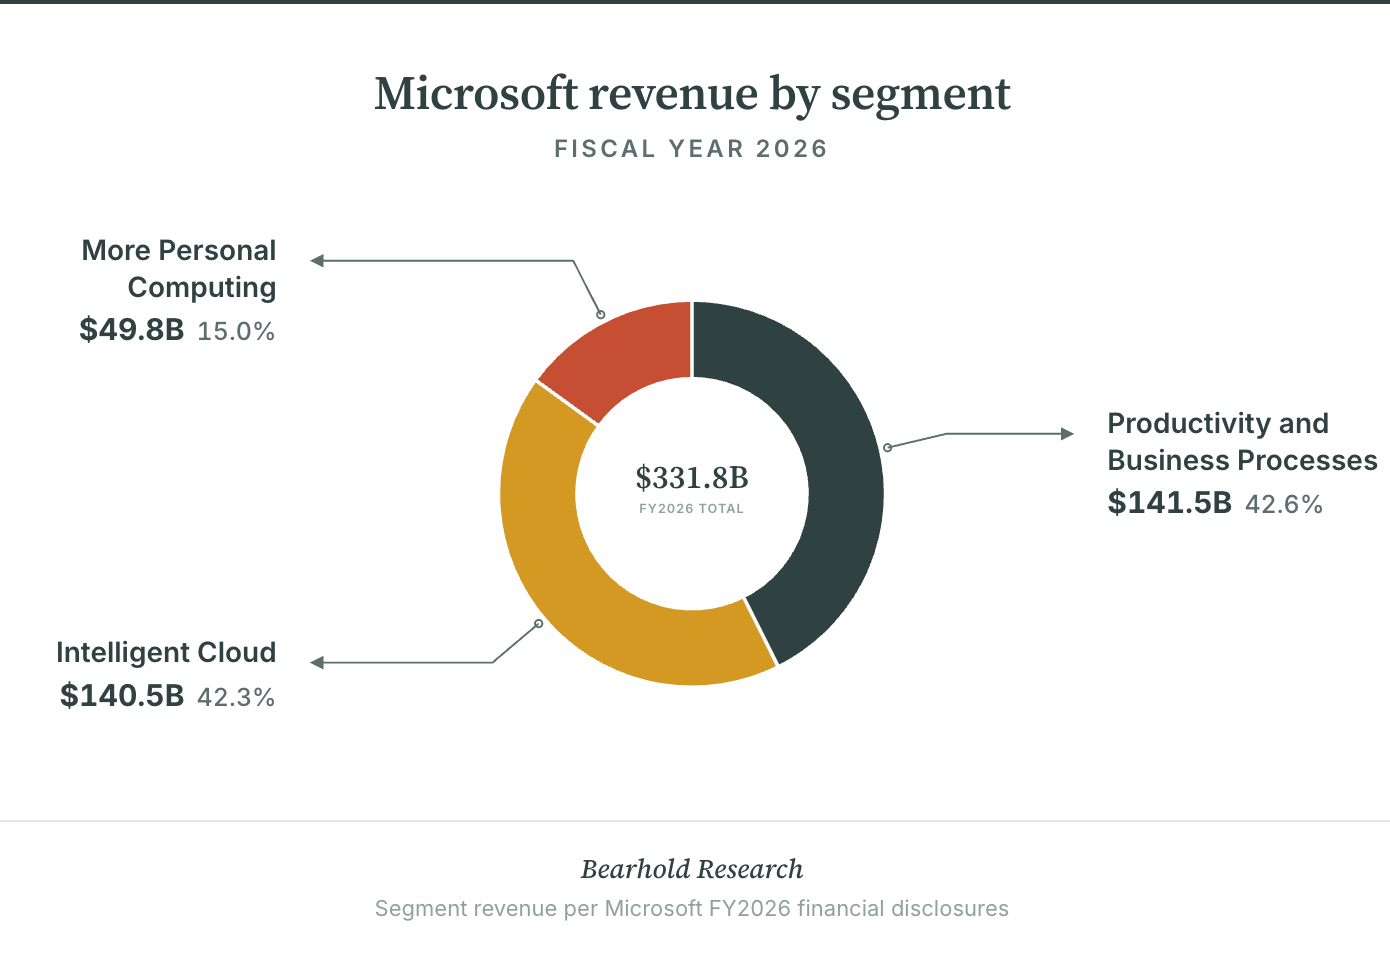
Microsoft manages its global operations across three primary reporting divisions, designed to align reporting with how enterprise solutions are deployed and managed:
The Productivity and Business Processes segment serves as the core of Microsoft’s commercial software suite. Its primary engine is Microsoft 365 Commercial, which integrates Office productivity applications, Microsoft Teams, Exchange, SharePoint, OneDrive, Enterprise Mobility + Security (EMS), and Windows Commercial cloud services.
Following the reporting realignment, this division also houses developer productivity tools, including GitHub (monetized through seat-based subscriptions and GitHub Copilot), alongside per-user Power BI, Microsoft 365 Consumer subscriptions, LinkedIn (monetizing through Talent Solutions, Marketing Solutions, Premium Subscriptions, and Sales Solutions), and Dynamics business applications (comprising Dynamics 365 cloud ERP and CRM, Power Apps, and Power Automate). By consolidating all per-user SaaS software and developer productivity suites into this division, Microsoft captures steady, highly profitable recurring cash flows from corporate seat expansions.
The Intelligent Cloud segment operates as the enterprise public cloud, hybrid infrastructure, and technical services foundation of the company. Anchored by Azure, this segment delivers consumption-based infrastructure-as-a-service (IaaS) and platform-as-a-service (PaaS) capabilities supporting elastic compute, relational and non-relational database management, enterprise data analytics, and developer AI runtimes through Azure OpenAI Service.
The division also encompasses hybrid on-premises server environments, including Windows Server, SQL Server, and Azure Arc, as well as Enterprise Support and Consulting services (Microsoft Customer Experience & Success). Azure serves as the physical and logical destination for enterprise workload migrations, linking Microsoft’s top-line growth directly to global digital data expansion and AI compute consumption.
The More Personal Computing segment connects software, content, and services directly to individual consumers and device ecosystems. This division includes Windows OEM licensing, non-cloud commercial software, Gaming hardware and content (comprising Xbox consoles, Xbox Game Pass subscriptions, Xbox Cloud Gaming, and first-party game studios following the $75.4 billion acquisition of Activision Blizzard), Search and news advertising via Bing and Microsoft Edge, and first-party Surface hardware devices.
While More Personal Computing generates substantial cash flows, its relative share of consolidated revenue has decreased over time as enterprise cloud and software subscription divisions expand.
Microsoft extracts commercial value across four distinct operational mechanisms:
First, per-seat Software-as-a-Service (SaaS) subscriptions generate recurring revenue through multi-year enterprise agreements (E3 and E5 licensing tiers) supplemented by add-on agentic software modules such as Microsoft 365 Copilot, priced at $30 per user monthly.
Second, consumption-based hyperscale infrastructure charges enterprise clients dynamically based on compute runtime, storage volume, data egress, and API query volumes across Azure.
Third, transactional licensing and hardware sales monetize upfront software purchases for on-premises server environments, packaged consumer software, Windows OEM licenses, and physical devices.
Fourth, digital advertising and platform royalties generate revenue from Bing search queries, LinkedIn sponsored feeds, and third-party game sales on the Xbox platform.
This commercial architecture is supported by a physical and operational footprint. Microsoft operates over 400 physical datacenters located across more than 70 Azure availability regions globally, connected by millions of miles of terrestrial and subsea dark fiber. This physical network underpins a contracted Commercial Remaining Performance Obligation (RPO) of $678 billion, representing committed multi-year enterprise cloud and software spending.
The company’s digital distribution channels reach deep into global corporate workflows, supported by more than 400 million commercial Microsoft 365 seats, 30 million paid Copilot seats, 89 million consumer M365 subscribers, 1.2 billion registered LinkedIn members, and a cybersecurity telemetry footprint protecting over 1.5 million institutional customers worldwide.
2- Structural Moats and Competitive Advantages
The fundamental reason Microsoft can commit over $100 billion annually to physical capital expenditures is the durability of its underlying economic moats. In my analysis, Microsoft’s competitive advantages stem from four reinforcing structural drivers that protect its return on invested capital and generate high customer retention across economic cycles.
The Four Pillars of Microsoft’s Economic Moat:
High Switching Costs and Identity Layer Integration
Enterprise operations are embedded into Microsoft’s identity management and authentication architecture. Microsoft Entra ID (formerly Azure Active Directory) serves as the primary authentication, single sign-on, and security clearance layer for global corporate IT environments. Replacing Entra ID, Microsoft Exchange Server, SharePoint file structures, and mission-critical Excel spreadsheet models introduces severe operational risk, massive regulatory compliance overhead, and multi-year implementation timelines. Furthermore, as enterprise data estates built on legacy SQL Server instances are migrated into Azure Synapse or Microsoft Fabric, they create structural data gravity. Cloud data egress costs and complex database interdependencies make switching to competing hyperscalers architecturally difficult and cost-prohibitive.
Proprietary Data Gravity and the Microsoft Graph
Generative AI models and enterprise software agents depend heavily on internal business context to deliver actionable output. Microsoft possesses an irreplaceable structural asset in the Microsoft Graph, a repository of enterprise operational telemetry spanning corporate emails, calendar schedules, Teams collaboration logs, file repositories, and organizational hierarchies. This repository provides the grounding context required for generative AI tools like Microsoft 365 Copilot and autonomous software agents built via Copilot Studio. Standalone model providers and competing software vendors lacking access to this proprietary business context cannot replicate the contextual accuracy of Microsoft’s AI tools, creating a data-gravity advantage that strengthens as enterprise interaction frequency increases.
Supply-Side Hyperscale Economies of Scale
Operating hyperscale cloud networks and deploying high-density AI clusters requires vast capital resources. Microsoft amortizes its $115.90 billion annual cash CapEx budget across more than 400 million commercial seats, millions of enterprise virtual machines, and broad consumer surfaces including Bing, Xbox, and LinkedIn. This massive distribution base provides distinct unit-cost advantages in server procurement, power purchase agreements (PPAs), custom silicon development (such as Maia AI accelerators and Cobalt CPUs), and automated datacenter cooling infrastructure that mid-tier cloud providers and pure-play software vendors cannot match.
Enterprise Packaging and TCO Bundling Dynamics
Microsoft leverages its global enterprise sales force and distribution channels by packaging adjacent software tools into unified commercial licensing tiers, such as Microsoft 365 E5. By bundling advanced cybersecurity (Microsoft Defender, Sentinel, Purview), corporate communications (Teams Phone), and business analytics (Power BI) into existing commercial contracts, Microsoft delivers total-cost-of-ownership (TCO) savings of 40% to 60% compared to purchasing standalone point solutions from independent vendors. This packaging capability allows Microsoft to capture market share across new enterprise software categories with minimal incremental customer acquisition costs.
3- Competitive Landscape and Market Share Dynamics
Microsoft operates across several core technology sectors against well-capitalized hyperscale peers, enterprise software providers, pure-play cybersecurity vendors, and digital entertainment networks.
In the worldwide cloud infrastructure sector, Microsoft Azure maintains the second-largest market share globally at approximately 21%, trailing Amazon Web Services (28% to 30% share) and leading Google Cloud Platform (14% share). Azure’s strategic advantage remains its hybrid cloud bridge, Azure Arc, which enables enterprise clients to manage multi-cloud and on-premises server environments seamlessly.
Azure’s annual revenue surpassed $100 billion in FY2026, driven by hybrid enterprise workload migrations and expanding demand for AI model training and real-time inference runtimes.
In enterprise productivity and SaaS, Microsoft 365 maintains a dominant position, commanding over 50% market share in enterprise office suites. While Google Workspace competes effectively in the small-to-medium business and education sectors, Microsoft retains a strong hold among Fortune 500 companies and regulated institutional clients due to its enterprise compliance controls, identity integration, and legacy desktop software dependencies. In enterprise application software, Dynamics 365 competes against Salesforce, ServiceNow, and SAP, maintaining double-digit revenue growth by offering native integrations with Microsoft Teams and Power Platform automation workflows.
In cybersecurity, Microsoft has expanded into a major industry vendor, generating over $20 billion in annualized security revenue across Microsoft Defender, Sentinel, Entra, Purview, and Intune. Microsoft competes directly against pure-play security vendors such as Palo Alto Networks, CrowdStrike, Fortinet, and Zscaler. Microsoft’s market position is supported by its integration at the operating system and identity layers, allowing it to aggregate threat telemetry across 1.5 million enterprise clients and package security solutions directly into the Microsoft 365 E5 licensing suite.
In enterprise generative AI, Microsoft established an early leadership position through its partnership with OpenAI, which granted exclusive cloud infrastructure hosting rights for OpenAI model training and inference alongside commercial distribution rights through Azure OpenAI Service. It competes primarily against Alphabet (Google Gemini and Vertex AI) and Amazon (AWS Bedrock and its partnership with Anthropic). Microsoft’s AI-related revenue run rate reached $37 billion in early FY2026, driven by Azure AI compute consumption and Copilot seat expansion.
4- Macro Financial Performance & Detailed Statement Breakdown
Looking at Microsoft’s financial trends over the past six fiscal years (FY2021–FY2026), we see top-line revenue compounding, significant operating margin expansion, and a major decoupling between accounting earnings and free cash flow generation.
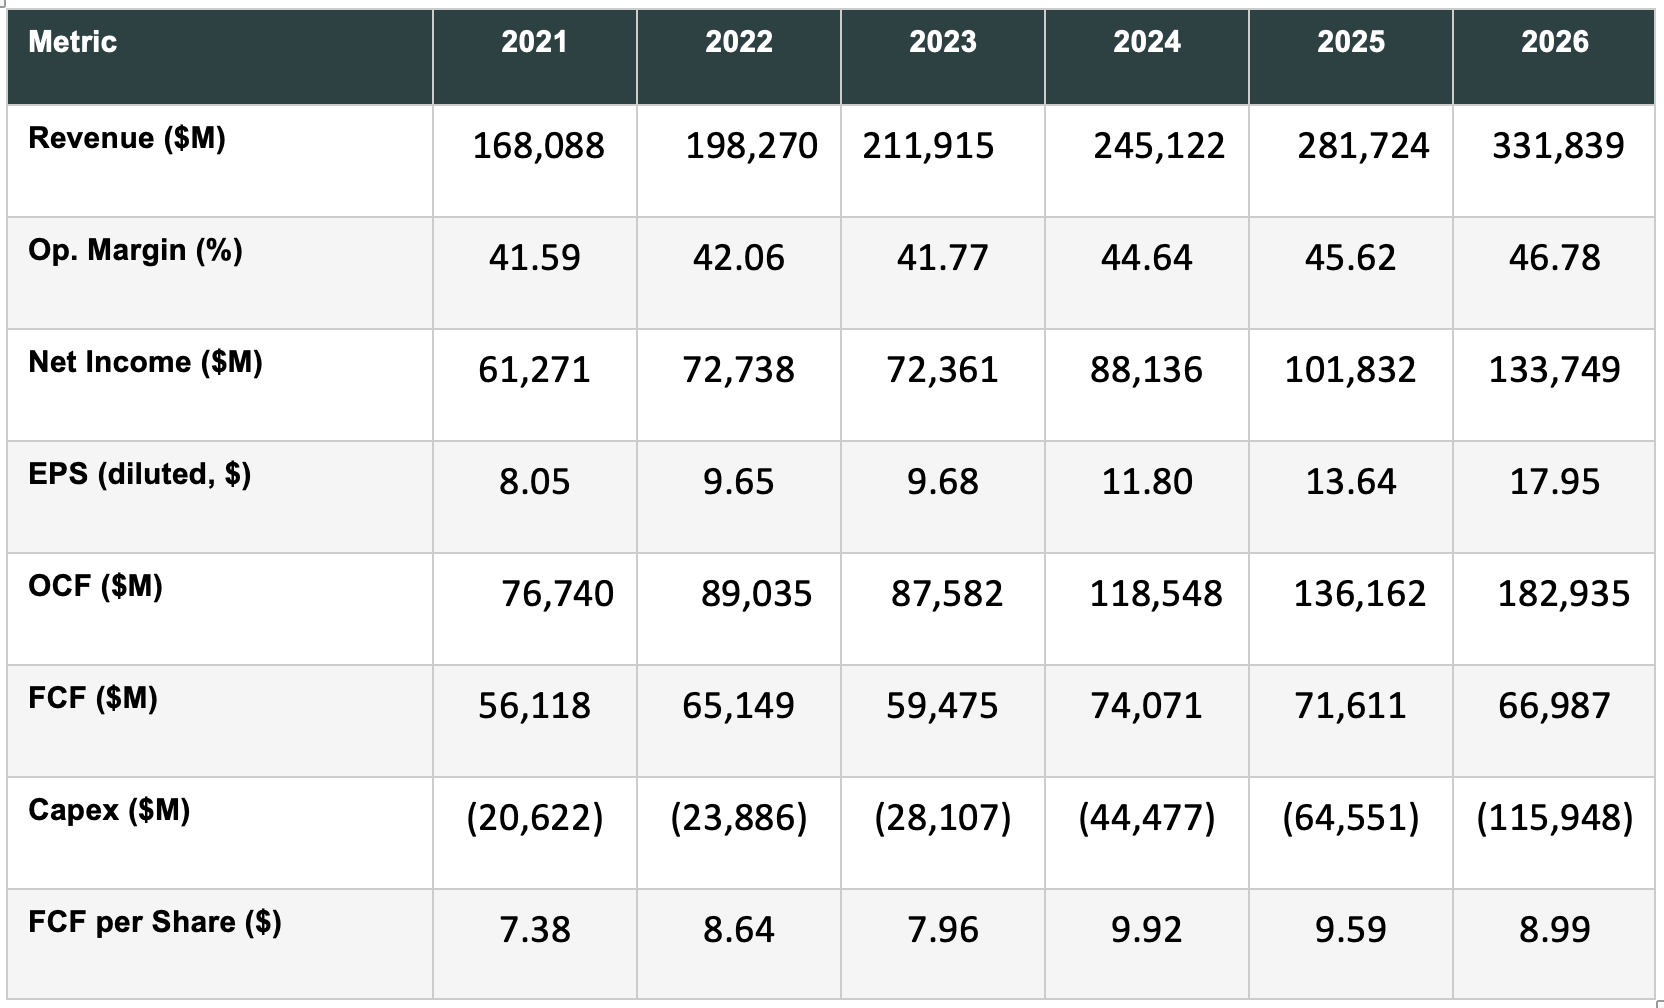
When I examine Microsoft’s revenue trajectory over the past decade, I see a clear transition from transactional software licensing to recurring cloud annuities. Consolidated revenue expanded from $168.09 billion in FY2021 to $331.80 billion in FY2026, representing a compound annual growth rate of 14.6%. Following a brief enterprise IT spending slowdown in FY2023 (+6.9% growth), top-line growth re-accelerated to 17.8% in FY2026.
This growth has been propelled by three main structural forces:
Azure Hyperscale Expansion: Azure revenue crossed $100 billion in FY2026, driven by core enterprise migration of mission-critical databases and an acceleration in AI compute demand via Azure OpenAI Service.
Commercial SaaS Seat & ARPU Upselling: Microsoft 365 Commercial revenue expanded consistently as enterprise agreements were upgraded from standard E3 tiers to premium E5 suites, boosted by initial seat additions for Microsoft 365 Copilot.
Cross-Platform Gaming & Dynamic Application Growth: The consolidation of Activision Blizzard expanded cross-platform gaming subscriptions (Xbox Game Pass), while Dynamics 365 maintained double-digit growth by integrating AI workflow automation.
Operating Margin Expansion & Segment Contribution Analysis
Consolidated operating margin expanded from 41.59% in FY2021 to an extraordinary 46.78% in FY2026. To understand how Microsoft achieved this 519-basis-point margin expansion during a period of massive physical buildouts, we must analyze segment operating profitability:
Productivity and Business Processes (PBP): PBP is the crown jewel of Microsoft’s operational profitability, expanding segment operating margins from 55.9% to 59.9%. Because per-seat SaaS applications and developer suites (Office 365, GitHub Enterprise/Copilot, LinkedIn, Dynamics 365) incur very low incremental marginal costs once the core software is built, seat expansions and E5 suite upgrades flow directly into operating profit. PBP has been the single largest contributor to consolidated margin expansion, providing a highly profitable recurring software cushion.
Intelligent Cloud (IC): Intelligent Cloud operates at high absolute profit levels ($140.5 billion revenue in FY2026), with operating margins contracting from 43.2% to 41.3%. While scale efficiencies in server procurement and automated datacenter management supported margin expansion through FY2024, rising server depreciation charges flowing into Cost of Goods Sold have begun to temper margin upside.
More Personal Computing (MPC): MPC operates at lower and more volatile operating margins (25% to 35%), as hardware sales (Surface, Xbox consoles) carry lower gross profitability and search advertising involves traffic acquisition costs. The relative mix shift of Microsoft’s business away from MPC and toward PBP and Intelligent Cloud has naturally pulled consolidated operating margins higher over time.
Net income expanded alongside operating income, reaching $133.75 billion GAAP in FY2026. Excluded from core operational performance is a ~$5.0 billion non-cash net investment gain from the OpenAI restructuring, yielding an Adjusted Net Income of $128.75 billion (representing a 52.07% FCF conversion rate). If the $3.2 billion Anthropic valuation gain is also excluded, combined adjustments total $8.2 billion, resulting in a further-adjusted net income of $125.55 billion and a FCF conversion rate of 53.40%.
Earnings Per Share (EPS) vs. Free Cash Flow Per Share Divergence
One of the most critical trends in this financial analysis is the sharp decoupling between Diluted EPS growth and Free Cash Flow (FCF) per share growth.
Between FY2021 and FY2026, GAAP Diluted EPS grew by 123.0% (rising from $8.05 to $17.95). Over that exact same period, Free Cash Flow per share grew by just 22.1% (rising from $7.38 in FY2021 to $9.92 in FY2024, before falling back to $8.99 in FY2026).
Why did this divergence occur? It is the direct mathematical consequence of CapEx intensity. Under GAAP accounting rules, cash spent on capital expenditures is capitalized to the balance sheet and recognized on the income statement gradually over 3 to 15+ years through depreciation expense. Consequently, Net Income and EPS benefit from delayed cost recognition.
Free Cash Flow, however, subtracts cash CapEx immediately ($115.90 billion in FY2026) from Operating Cash Flow ($182.935 billion). As CapEx expanded from 12.27% of revenue in FY2021 to 34.93% in FY2026, cash outlays drained Free Cash Flow generation while accounting EPS continued to print new highs. FCF conversion relative to Net Income compressed from 91.59% down to 50.12% (52.07% on an adjusted basis).
Capacity Buildout Lag Led to Declining Return Metrics
Return on Capital peaked at 30.30% in FY2021 before entering a steady multi-year decline to 20.7% in FY2026.
This decline in return metrics is not caused by operational decay or failing pricing power. Rather, it is driven by a classic capacity buildout lag.
When Microsoft spends $115.90 billion in cash CapEx in a single year, Property, Plant, and Equipment (Gross PP&E) and total invested capital expand on the balance sheet immediately. However, mega-scale datacenter campuses, high-voltage power substations, and supercomputing clusters take 12 to 36 months to construct, power up, and populate with paying enterprise software workloads.
Because the invested capital denominator expands instantly while the operational profit numerator arrives with a multi-year delay, Return on Capital temporarily compresses. Return metrics will only stabilize once these massive fixed assets become fully operational and productive.
Balance Sheet Strength and Debt Structure
Despite elevated capital spending, Microsoft retains an extraordinarily strong balance sheet. The Debt-to-Equity ratio improved from 0.48x in FY2021 to 0.11x in FY2026, as total stockholders’ equity expanded to $442.4 billion. Cash, cash equivalents, and short-term investments totaled $76.7 billion against $47.6 billion in total debt, leaving Microsoft in a solid net cash position of nearly $29.1 billion, backed by AAA credit ratings.
Furthermore, Microsoft finances its physical buildouts entirely through internal operating cash flow ($182.935 billion in FY2026), eliminating any need for debt financing and preserving complete financial flexibility.
5- Granular CapEx Breakdown, Accounting Mechanics, and The Maintenance Treadmill
Connecting the macro financial performance to the physical asset base, we now examine the structural composition of Microsoft’s capital expenditures, its accounting policy adjustments, and the downstream maintenance treadmill.
Analytical Note: Microsoft does not break out an explicit line-item dollar split between hardware and real estate in Form 10-K filings. The estimates below reflect executive disclosures from CFO Amy Hood indicating that capital allocation shifted as high-density AI clusters accelerated, moving from an even split early in the cloud era to approximately two-thirds allocated to short-lived compute assets (GPUs, CPUs, and network gear) and one-third to long-lived datacenter facilities and physical infrastructure during the peak FY2025–FY2026 buildouts.
Hardware vs. Real Estate Breakdown (Analytical Modeled Estimate, CFO Guided Mix)
In the early cloud scaling phase (FY2014–FY2021), capital spending maintained a balanced profile, averaging an estimated 50% for servers/hardware and 50% for real estate/physical structures. Long-lived outlays were necessary to construct physical shells, acquire land, and build electrical substations.
During the AI infrastructure surge (FY2023–FY2026), outlays tilted heavily toward short-lived compute assets (~66.7%), leaving long-lived real estate at roughly one-third (~33.3%). High-density AI compute clusters command significantly higher hardware costs per square foot than traditional cloud servers, directing outlays into technology hardware subject to shorter depreciation cycles. In FY2026 alone, $77.27 billion out of the $115.90 billion cash CapEx budget went toward fast-moving silicon and server hardware.
Growth CapEx & Quantifying the “Maintenance Treadmill”
Analytical Note: Microsoft does not publish a GAAP split between Growth and Maintenance CapEx. The figures below reflect financial modeling estimates based on server fleet replacement lifecycles.
During FY2023–FY2026, Growth CapEx expanded to represent an estimated 82% to 85% of total outlays ($98.52 billion in FY2026) as Microsoft raced to expand AI compute capacity. A critical structural insight of this analysis is that a significant portion of today’s “Growth CapEx” is a recurring maintenance obligation in disguise.
When Microsoft spends $10 billion on real estate, that asset lasts 15+ years with minimal upkeep. But when it spends $77.27 billion in a single year on GPUs, custom accelerators, and networking gear, those assets experience physical wear and technological obsolescence every 3 to 4 years. To quantify this conversion:
In FY2026, Microsoft deployed an estimated $65.70 billion in Growth CapEx specifically for short-lived server/GPU hardware ($98.52B Growth CapEx × 66.7% hardware mix). Because this hardware must be turned over every 3 to 4 years, approximately $50 billion to $60 billion of this annual Growth spend will permanently convert into recurring Maintenance CapEx by FY2028–FY2030.
Combined with facility upkeep ($15B–$20B), this establishes a permanent annual Maintenance CapEx floor of $75 billion to $85+ billion. Microsoft is establishing a permanently higher capital floor. What is characterized as growth investment today will become the baseline cost of staying operational tomorrow.
Evaluation of Accounting Treatment Policy Shifts
As disclosed in the 10-K filings, Microsoft’s official property and equipment accounting schedule is as follows: “software developed or acquired for internal use, three years; servers and network equipment, two to six years; buildings and improvements, five to 15 years; leasehold improvements, three to 15 years; and furniture and equipment, one to 10 years. Land is not depreciated.”
Analyzing these policy choices reveals critical insights:
FY2023 Server Useful Life Extension (Quantified Fact): In FY2023, Microsoft extended the estimated useful life of server and network equipment from 4 to 6 years, which reduced FY2023 depreciation expense by $3.7 billion across the full fiscal year (with approximately $1.1 billion recognized in the first quarter of FY2023), directly boosting pre-tax operating income during an enterprise cloud growth deceleration.
Buildings & Improvements Schedule (10-K Anchored): As explicitly stated in Note 1 of the Form 10-K, physical buildings and site improvements are depreciated over 5 to 15 years. In discussing the extension of datacenter building depreciable lives into FY2027, CFO Amy Hood explicitly characterized the accounting adjustment as having a “minimal benefit to FY27 operating income,” reflecting that rapid hardware depreciation continues to dominate the cost profile.
My View on Accounting Alignment is that while depreciating physical buildings over 15 years matches standard commercial real estate schedules, amortizing fast-moving AI silicon over up to 6 years outpaces technological reality. High-density AI accelerators running under continuous 100% utilization face thermal degradation and performance-per-watt obsolescence every 3 to 4 years. Depreciating AI hardware over 6 years creates an ongoing disconnect where accounting earnings benefit from delayed depreciation while the balance sheet retains assets whose true economic value is decaying faster than reported.
6- Growth Levers, Addressable Target Markets (TAM), and Catalysts
To justify this massive infrastructure spending, Microsoft must expand its top-line revenue across large growth vectors. The potential runway for enterprise software and cloud monetization remains substantial, provided execution stays on track.
The monetization of artificial intelligence represents Microsoft’s most direct organic growth lever. With over 400 million commercial Microsoft 365 seats globally and paid Copilot seats standing at 30 million, current penetration remains under 10%.
The primary growth catalyst is not merely acquiring new users, but driving average revenue per user (ARPU) expansion. Standard commercial Microsoft 365 seats generate between $15 and $38 per user monthly. Adding Microsoft 365 Copilot at $30 per user monthly increases subscription ARPU by 80% to 150% per converted seat.
Furthermore, as enterprise workflows evolve from simple copilot assistance toward autonomous AI agents built via Copilot Studio, monetization expands into multi-agent orchestration billing. This transition enables Microsoft to capture value from workflow automation rather than basic software licensing.
The global cloud infrastructure market (IaaS and PaaS) continues to expand as enterprises migrate core workloads out of corporate datacenters. Azure’s primary catalyst is enterprise data estate modernization. Foundation AI models cannot generate useful enterprise output without access to clean, structured, and secure internal business data.
Microsoft Fabric addresses this requirement by unifying data engineering, data warehousing, real-time analytics, and governance into a single cloud environment. As corporate clients deploy Fabric to organize their operational data estates, Fabric adoption drives downstream consumption into Azure SQL databases, Azure Cosmos DB, and Azure AI runtimes, creating a compounding revenue feedback loop inside Intelligent Cloud.
The enterprise cybersecurity market represents an expanding target addressable market, accelerated by rising cyber threat frequency and strict regulatory compliance requirements. Chief Information Officers (CIOs) are actively seeking to reduce operational complexity by consolidating fragmented point-security tools into unified platforms.
Microsoft is uniquely positioned to capture this consolidation trend. By packaging advanced security, including Microsoft Defender endpoint protection, Sentinel SIEM analytics, Entra ID identity governance, and Purview data compliance, directly into the Microsoft 365 E5 licensing suite, Microsoft offers total-cost-of-ownership savings of 40% to 60% compared to purchasing standalone security solutions from Palo Alto Networks, CrowdStrike, or Zscaler. Upselling commercial clients from E3 to E5 licensing tiers expands enterprise SaaS ARPU while expanding high-margin security revenues.
While top-line growth vectors expand revenue, internal custom silicon development serves as a major margin catalyst. Relying exclusively on merchant third-party GPUs creates a margin bottleneck due to high chipmaker procurement premiums.
Microsoft’s ongoing deployment of first-party custom silicon, specifically its Maia AI accelerators for model training/inference and Cobalt ARM-based CPUs for general cloud workloads, improves unit compute economics. Custom silicon delivers an estimated 30%+ improvement in performance-per-dollar, allowing Azure to process AI API queries at lower operational costs and protecting long-term cloud margins as AI consumption scales.
7- Valuation
Growth Engines
The future return on Microsoft stock is a function of two engines: the future growth in free cash flow per share, and any valuation re-rating. Both are explained below.
Engine 1: Fundamentals
The first engine is the business itself. FCF per share grows over time through revenue expansion, operating leverage, and share count reduction from buybacks. That growth, compounded annually, is what the fundamental engine delivers regardless of any valuation re-rating.
For Microsoft, I assume FCF per share growth averaging between 12% and 15% over the first decade of the projection period. The primary driver is the Productivity and Business Processes segment continuing to expand margin, from 55.9% toward 59.9% and beyond, compounding on top of Azure and Intelligent Cloud, which kept growing revenue well above 30% even as the segment absorbs the cost of the current infrastructure buildout.
Buybacks add a further per-share amplification effect, diluted share count has already fallen from 7.61 billion to 7.45 billion over the past five years, even through a period where capital was heavily redirected toward the current capex program.
Unlike a business whose elevated capital spending is a maturing, finite buildout set to normalize, I don’t expect Microsoft’s free cash flow conversion to recover toward its historical levels as this cycle plays out. The maintenance treadmill argument covered earlier in this report, that a large share of today’s growth capex converts into permanent recurring replacement spending as short-lived AI hardware turns over every three to four years, means this fundamental engine has to deliver its growth without the tailwind of capital intensity falling back toward its historical baseline.
Engine 2: Valuation Re-Rating
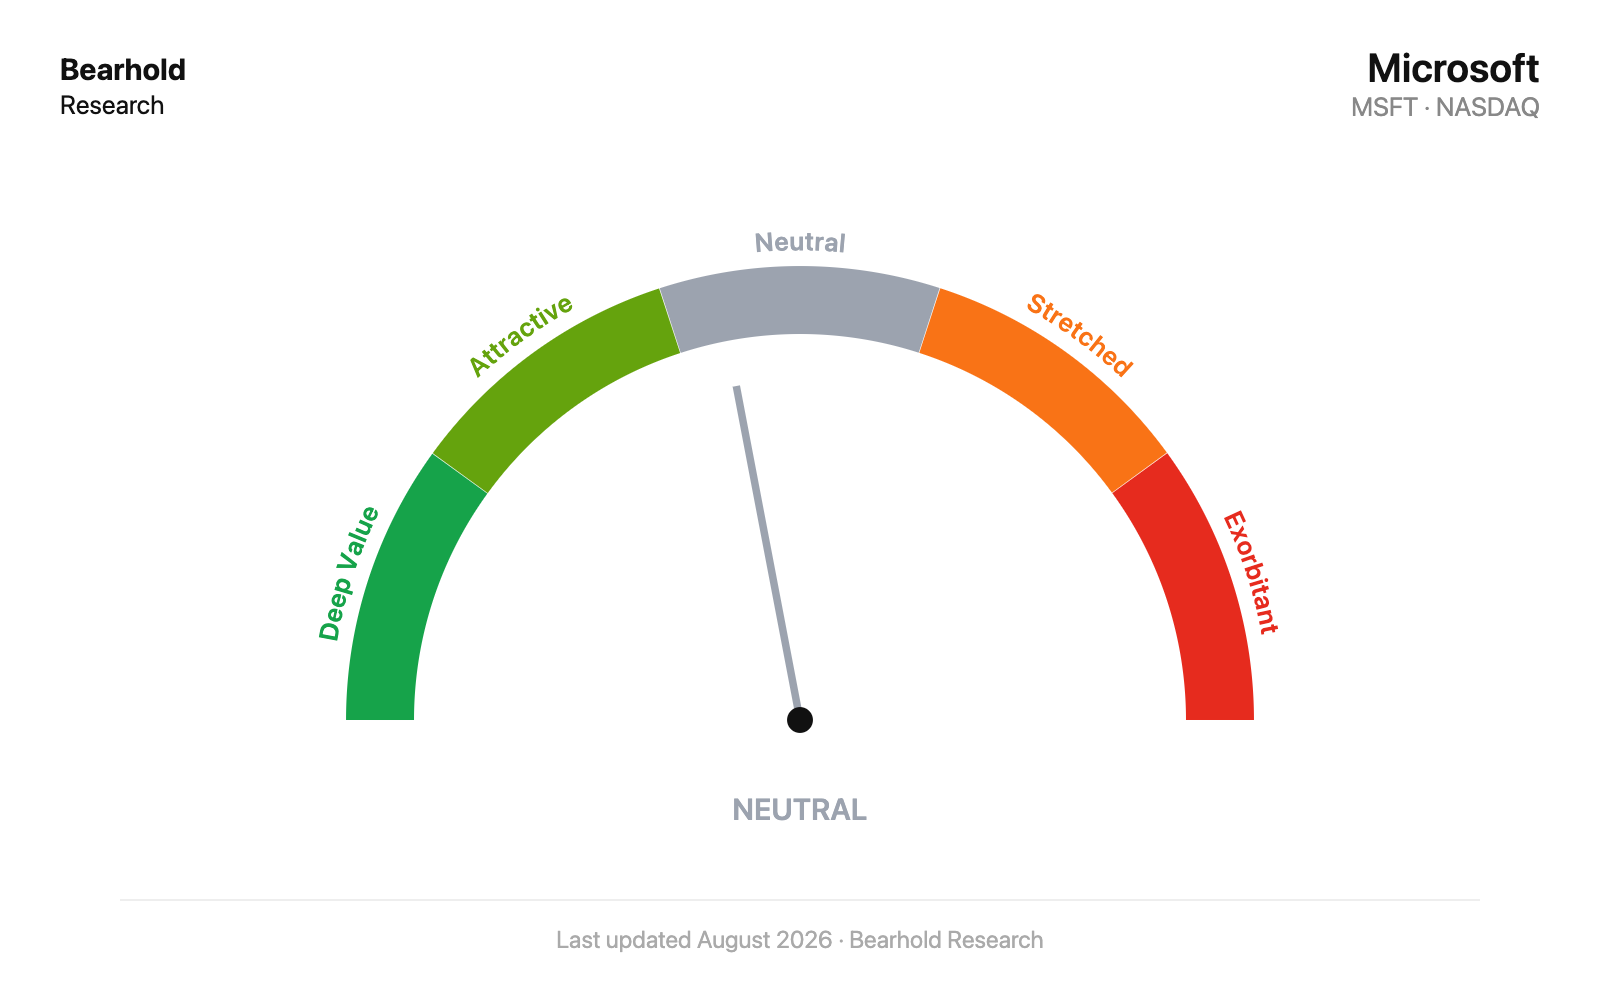
At today’s price of approximately $500, the investor is paying for everything this business will earn over roughly the next 21 years, in today’s money. Everything it earns beyond that point comes to the investor at no additional cost. The fewer the embedded years, the more of the future the investor receives without paying for it.
At 21 embedded years, the price sits in the Neutral zone on my own valuation scale. This is a price shaped by the open questions I addressed in the Financial Performance and Risks sections, specifically whether the maintenance treadmill argument proves accurate and whether the OpenAI relationship continues sending the concentration of compute demand through Azure that today’s backlog assumes.
At 21 embedded years, I expect future returns to come primarily from Engine 1, the underlying growth in free cash flow per share, with only a slight additional boost from Engine 2, since the valuation itself has relatively limited room to re-rate meaningfully from here.
Hold, Add, and Exit Logic
This framework isn’t a mechanical buy-and-sell signal, it’s a way of thinking about price relative to value. In the Deep Value and Attractive zones, the price is working in the investor’s favor, more future cash flow is embedded per dollar paid than the market typically offers for a business of this quality. In the Neutral zone, future returns are expected to come primarily from Engine 1 with only a slight boost from Engine 2, whereas the Stretched and Exorbitant zones embed high optimism with little to no margin for error.
8- Major Strategic Risks and Threats
Analyzing Microsoft’s multi-year outlook, I highlight four primary enterprise risks that could impact corporate valuation and operational execution:
The CapEx Intensity Treadmill & Operating Leverage Reversal
The primary financial risk facing Microsoft is the potential mismatch between capital expenditure pacing and enterprise revenue realization. With cash CapEx reaching 34.9% of revenue ($115.90 billion in FY2026), Microsoft has established a high fixed physical cost structure.
If enterprise adoption of Copilot seats or generative AI agents develops more slowly than anticipated, or if algorithmic efficiency gains reduce the compute power required for inference, Microsoft could face excess compute capacity. Because short-lived silicon and high-density servers carry rapid 3-to-4-year physical replacement lifecycles, an expanded capital asset base will generate elevated ongoing depreciation drag, compressing operating margins if top-line revenue growth decelerates.
Strategic Interdependence & OpenAI Concentration Risk
Out of Microsoft’s $678 billion commercial Remaining Performance Obligation (RPO), it is estimated that approximately 32% (nearly one-third) is tied to OpenAI infrastructure commitments.
This creates a circular operational dependency as Microsoft deploys cash CapEx to construct specialized supercomputing clusters, which host OpenAI model workloads that form a large portion of Microsoft’s commercial backlog. If OpenAI experiences corporate governance friction, intellectual property challenges, or chooses to diversify its compute hosting across competing cloud providers (such as Oracle or AWS), Microsoft could face unutilized compute capacity carrying fixed depreciation and facility power commitments.
Enterprise Customer ROI Friction & Model Commoditization
While early enterprise adoption of Microsoft 365 Copilot has been strong, corporate IT buyers are increasingly scrutinizing the clear return on investment (ROI) of paying $30 per user monthly. If enterprise clients determine that generative AI tools deliver incremental productivity gains rather than transformational cost savings, renewal rates could slow.
Furthermore, rapid advances in open-source foundation models (such as Meta’s Llama series and Mistral) could commoditize general reasoning models. If open-source models achieve performance parity with proprietary frontier models at zero software licensing cost, pricing power across Azure AI model APIs and Copilot seat add-ons could face competitive pressure.
Hyperscaler Custom Silicon Competition & Datacenter Power Constraints
Alphabet (Google TPUs) and Amazon (AWS Trainium/Inferentia) have invested in proprietary custom silicon architectures for over a decade. If competitors achieve superior cost-per-token efficiency using custom hardware compared to Azure’s merchant GPU and custom silicon mix, Azure could face cloud compute pricing pressure.
Simultaneously, real-world physical infrastructure bottlenecks pose operational challenges. AI datacenters require 3x to 5x more electrical power density than traditional cloud facilities. Securing multi-gigawatt utility power interconnects, nuclear power purchase agreements, and liquid-cooling hardware involves real-world construction delays. Power availability bottlenecks could prevent completed datacenter shells from being brought online, delaying revenue generation from capitalized assets.
The Verdict
When I synthesize this entire deep-dive analysis, the fundamental takeaway is that Microsoft’s core enterprise franchise remains one of the most powerful, highly defensible cash-generating engines in modern corporate history. Generating $182.935 billion in annual operating cash flow, building a contracted commercial Remaining Performance Obligation of $678 billion, scaling Azure past $100 billion in annual revenue, and expanding Microsoft 365 Copilot past 30 million paid seats all confirm that the company’s software monetization engine is operating at peak capacity. The enterprise identity layer anchored by Microsoft Entra ID, combined with deep software switching costs, total-cost-of-ownership suite packaging, and the proprietary grounding context of the Microsoft Graph, creates an expansive economic moat that protects organic profitability and generates immense customer retention across economic cycles.
At the same time, my analysis demonstrates that Microsoft’s underlying business model has undergone a permanent, structural shift. The enterprise is no longer an asset-light software pure-play capable of converting 90% of its net income directly into free cash flow; it has evolved into a hyperscale digital infrastructure utility. Deploying $115.90 billion in annual cash capital expenditures, absorbing 34.9% of consolidated revenues, alongside carrying $329.1 billion in off-balance-sheet uncommenced lease commitments, establishes a heavy physical cost base that fundamentally alters the company’s corporate finance profile. Because approximately two-thirds of this annual capital spending is concentrated in high-density GPUs, custom silicon, and server hardware that face physical degradation and technological obsolescence every three to four years, a major portion of today’s growth capital will permanently convert into a $75 billion to $85+ billion annual maintenance CapEx floor by the end of the decade.
Crucially, Microsoft possesses the balance sheet strength and cash-generating power to absorb this capital supercycle without compromising its financial integrity. Operating cash flow of $182.935 billion fully self-funds this $115.90 billion cash CapEx program with zero reliance on debt issuance, leaving $67.035 billion in residual free cash flow to support dividend growth and share buybacks. Supported by $442.4 billion in stockholders’ equity, $76.7 billion in liquid cash reserves against $47.6 billion in total debt, a 0.11x Debt-to-Equity ratio, and an impeccable AAA credit rating, Microsoft’s financial fortress is unmatched.
While equity investors must accept lower free cash flow conversion efficiency as the structural cost of artificial intelligence market leadership, Microsoft’s ability to monetize enterprise workflows while self-funding hyperscale infrastructure makes its long-term compounding thesis rock-solid. Taking all strategic, operational, and financial dimensions into account, the investment case and strategic buildout for Microsoft Corporation are fully APPROVED.
The author does not hold a position in Microsoft, Inc. at the time of publication. This report reflects the author’s personal views and is not investment advice. Investing carries the risk of permanent capital loss. Read full disclosure here.