



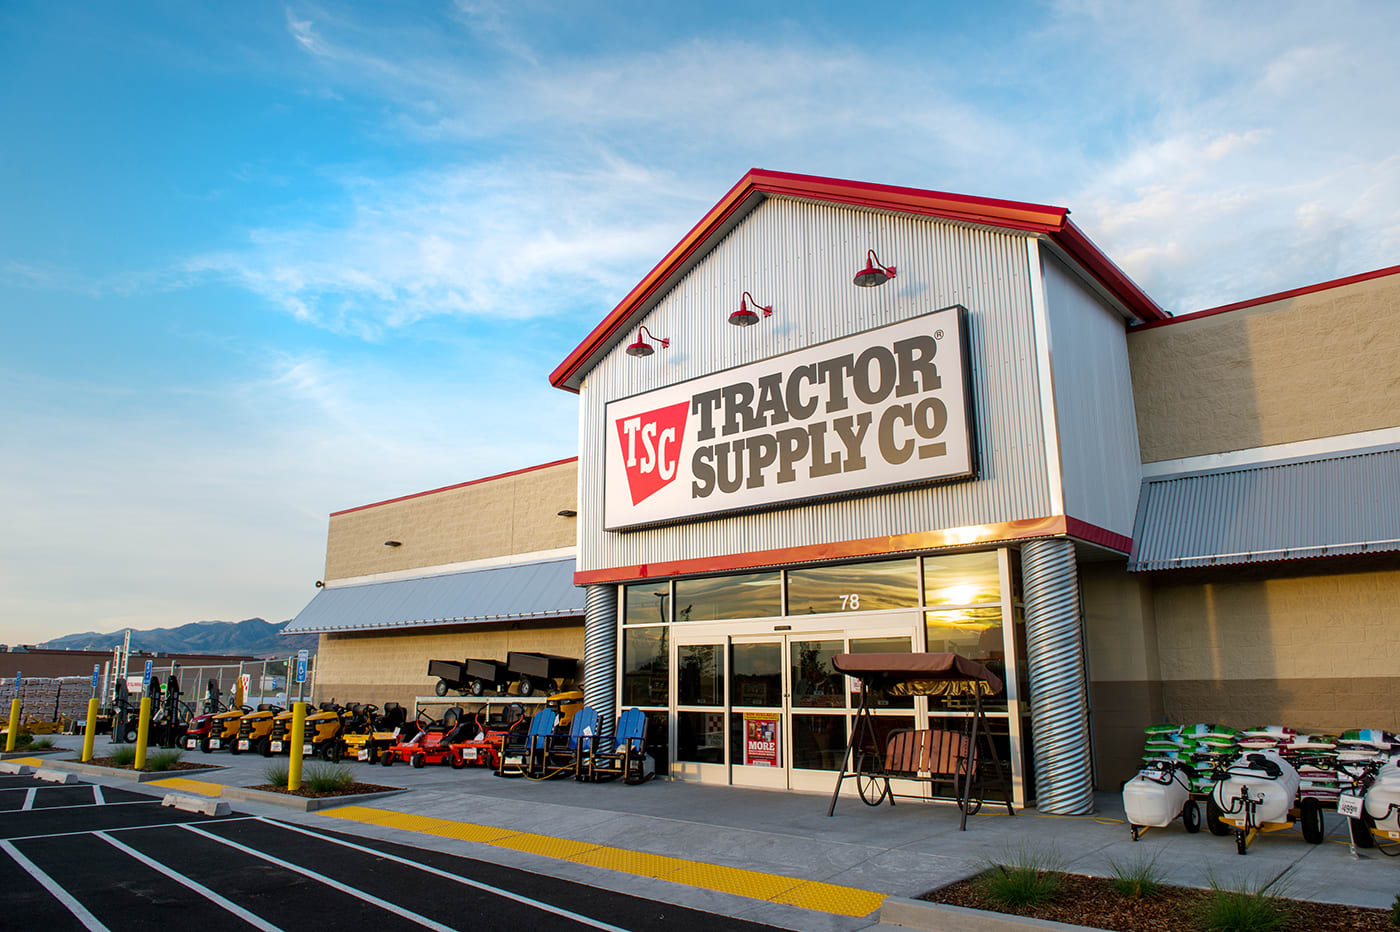
Tractor Supply is the largest rural lifestyle retailer in the United States, built on a needs based model that has produced 30+ consecutive years of revenue growth. The business is not glamorous. It sells livestock feed, fencing, work boots, and pet food to recreational farmers, ranchers, and rural homeowners, and it has done this with a discipline that has compounded steadily for three decades.
The stock has fallen by roughly half from its 2025 peak, while the business grew its revenue base explosively during the pandemic, held onto nearly all of that gain once demand normalized, and is now absorbing the cost of continued store growth against a slower, more ordinary sales backdrop. I believe the market is currently pricing this normalization as if it were deterioration.
At a Glance
Company: Tractor Supply Company
Ticker: $TSCO, NASDAQ
Sector: Consumer Discretionary
Industry: Rural Lifestyle & Specialty Retail
Status: Approved
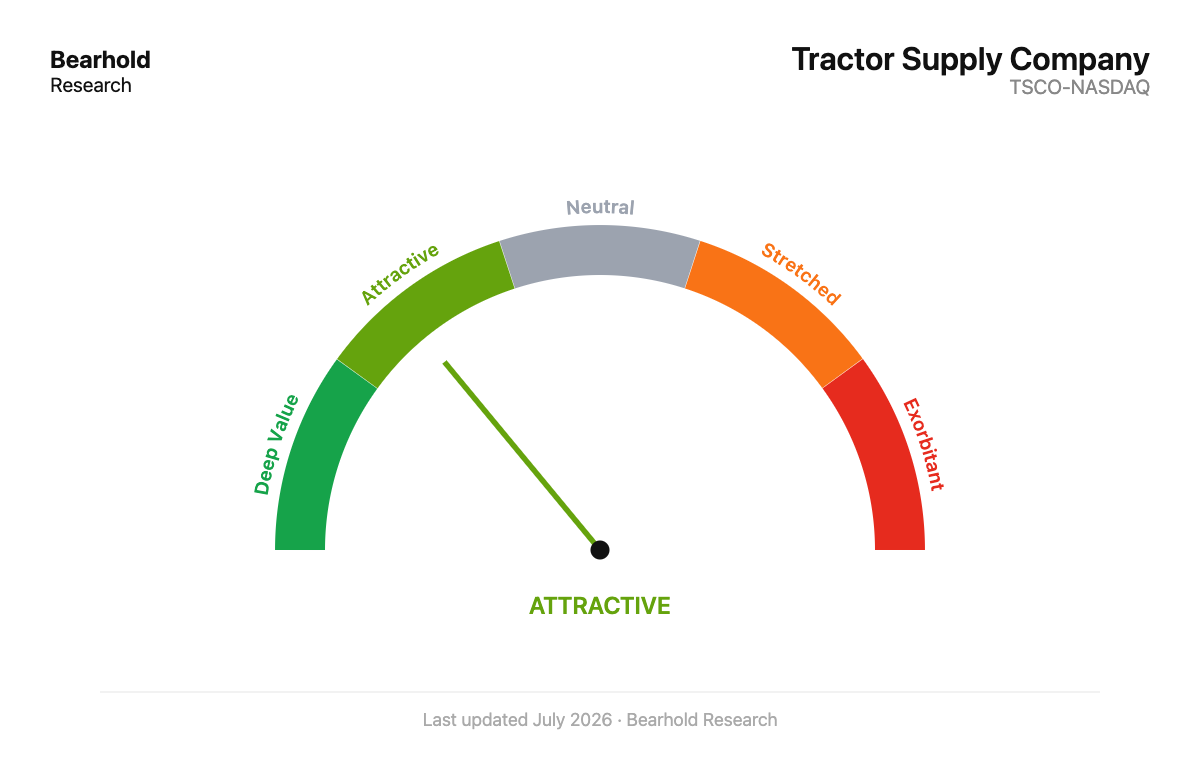
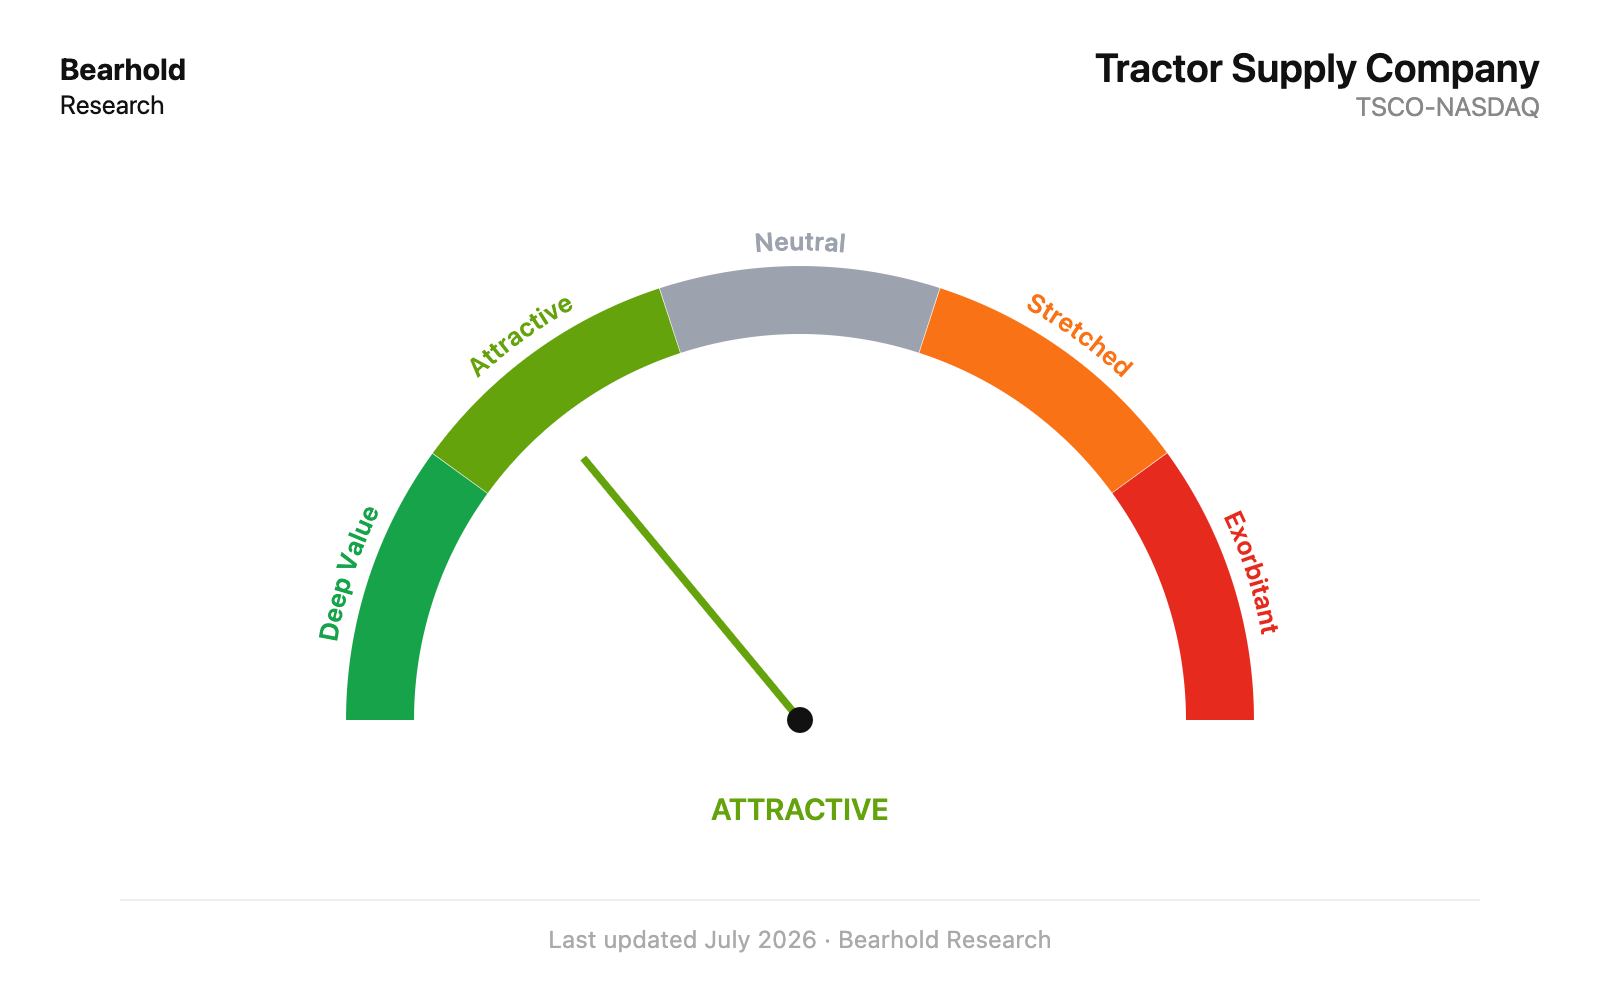
Valuation Zone: Attractive (17 embedded years, at approximately $29.4)
The author does not hold a position in Tractor Supply Company at the time of publication. This report reflects the author’s personal views and is not investment advice. Investing carries the risk of permanent capital loss. Read full disclosure here.
1. The Business
What it Does
Tractor Supply sells the products that support what the company calls the “Out Here” lifestyle: livestock and equine feed, fencing, seasonal and recreational goods, truck and tool hardware, work clothing, and companion animal products.
It operates under two banners, Tractor Supply Company and Petsense by Tractor Supply, and it owns an online pet pharmacy, Allivet, acquired in December 2024, and a veterinary services business, VIP Petcare, acquired in May 2026.
At the end of fiscal 2025, the Company operated 2,602 retail stores in 49 states, 2,395 under the Tractor Supply banner and 207 Petsense locations, supported by 10 distribution centers with a combined 7.8 million square feet of capacity.
How the Company Makes Money
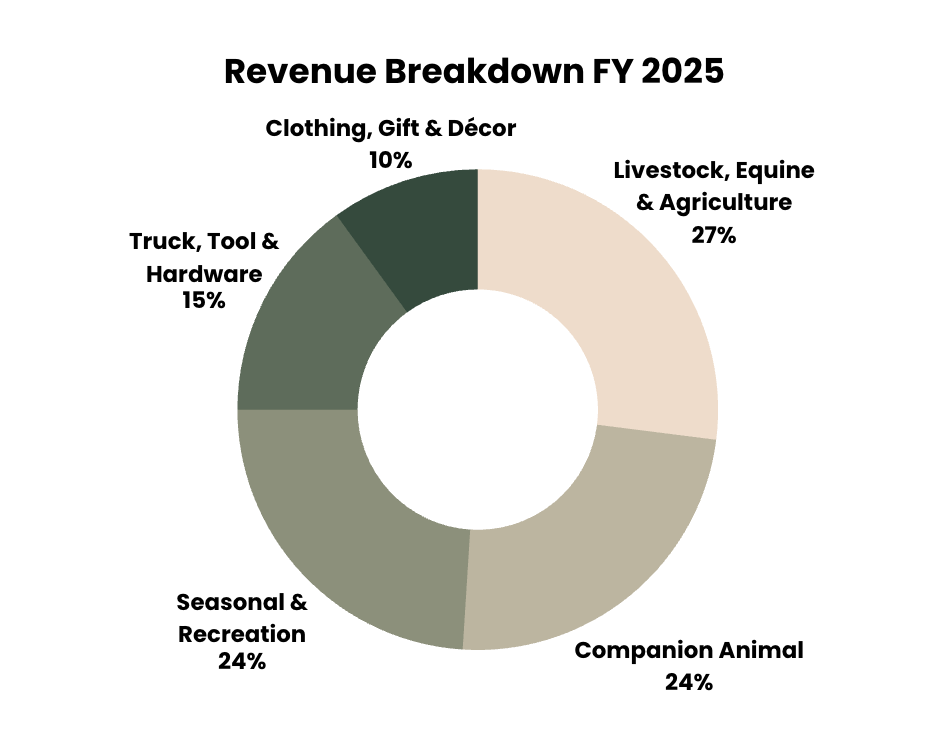
Tractor Supply is a straightforward merchandise retailer. Revenue comes from in store and online sales across five major product categories. In fiscal 2025, Livestock, Equine & Agriculture represented 27% of net sales, Companion Animal 24%, Seasonal & Recreation 24%, Truck, Tool & Hardware 15%, and Clothing, Gift & Décor 10%. No single product accounted for more than 10% of sales in fiscal 2025, and the Company sources from over 1,100 vendors, with no single vendor representing more than 10% of purchases. Owned brands and exclusive product categories made up approximately 30% of total sales in fiscal 2025, a mix I believe supports margin meaningfully relative to a pure national brand assortment.
History and Origin
Founded in 1938, Tractor Supply has operated for more than 85 years. The Company has grown from 2,105 stores at the end of fiscal 2020 to 2,602 stores at the end of fiscal 2025, a five year net addition of nearly 500 locations, while sustaining a five year net sales compound annual growth rate of approximately 7.9%.
Scale and Footprint
Tractor Supply stores typically range from 15,000 to 20,000 square feet of inside selling space, supplemented by outdoor “Side Lot” or Garden Center space. The Company leases approximately 97% of its stores, with roughly 61% in freestanding buildings and 39% in shopping centers. Approximately 81% of Tractor Supply store merchandise flows through the Company’s own distribution network, which I view as central to in stock consistency and freight efficiency. A new distribution center in Nampa, Idaho, the Company’s 11th, is under construction and expected to begin operations in the fourth quarter of 2026, adding approximately 865,000 square feet of capacity to serve the Pacific Northwest.
2. The Moat
I believe Tractor Supply’s moat rests on three pillars:
1. Geographic Isolation, or Efficient Scale
Tractor Supply deliberately avoids dense metropolitan areas. It builds stores in small towns and rural communities, markets that are often underserved by large national retailers and cannot support a full size Home Depot, Lowe’s, or Walmart. A market too small to justify a big box competitor’s investment is a market Tractor Supply can occupy and effectively monopolize at a much smaller store footprint and a much lower capital cost. Once a Tractor Supply store is established as the dependable supplier in one of these towns, it becomes the default destination for that entire trade area, and a national retailer has little economic incentive to build a second, larger store to contest a position that strong.
This geographic position creates a genuine convenience moat on top of the economic one. For a hobby farmer living 40 miles outside a major city, a 10 minute drive to the local Tractor Supply for a replacement tractor belt is far more practical than an hour’s drive to a metropolitan home center.
2. From “Bring Your Own Truck” to a Controlled Delivery Network
Historically, Tractor Supply’s delivery model placed the burden on the customer. Its distribution network was built to move inventory from centralized distribution centers onto store shelves, not into a customer’s driveway, and a hobby farmer needing fencing, a trailer, or several hundred pounds of feed was expected to load it into their own vehicle. Where e-commerce did exist, the Company relied on traditional parcel carriers whose networks are optimized for small, light packages, an economically poor fit for heavy, bulky agricultural goods, especially down low-density rural roads. This was a real vulnerability, the exact seam a well capitalized e-commerce competitor could have exploited.
The Company has spent the past two years closing that seam, and I believe what it has built is now a genuine structural barrier. The Final Mile initiative is built around Tractor Supply’s own local hub network, drivers and inventory from different facilities brought together at dedicated hub locations for last-mile delivery to nearby customers. That network has scaled to approximately 375 hubs, giving the Company last-mile delivery capability across more than 1,200 stores and reaching over 15 million customers, alongside continued use of gig delivery partners like UPS’s Roadie to further lower cost per delivery. The economics are already proving out, with roughly $10 million a year in freight-related savings identified so far, a program that is close to funding its own continued expansion.
This matters because it directly defends the same vulnerability this moat pillar is built around. A pure e-commerce competitor shipping heavy, bulky goods through standard parcel networks faces a structurally worse cost position than a company delivering the same items from a store already sitting a few miles from the customer, using its own fleet and hub infrastructure rather than renting space on a network built for small packages. The gap between those two cost structures does not close as a competitor scales, it is a function of physical weight and distance. Tractor Supply is deliberately widening that gap further, with a stated ambition to handle up to 95% of large-item deliveries entirely in-house by the end of the decade.
The July 2026 Instacart partnership handles the other half of the problem, fast delivery for light, everyday items that do suit a standard parcel network, without diverting capital from the harder, more defensible problem. Together, this is a business that has identified its single greatest e-commerce vulnerability and is systematically converting it into an advantage instead, which I consider one of the more underappreciated developments in the Company’s recent strategy.
3. Deep Customer Intangibles and a Proprietary Ecosystem
Tractor Supply serves recreational farmers and rural landowners, and it has built real, hard to replicate intangibles around that specific customer. The Neighbor’s Club loyalty program captures more than 80% of total Company sales, giving management a data asset most retailers of this size do not have; a granular, store level view of what a specific rural household actually buys and when. Exclusive, in house private label brands make up roughly 30% of total revenue. A customer who has built a habit around 4health pet food or Producer’s Pride livestock feed cannot simply walk into a Rural King or a Walmart and buy the identical product; they have to change brands, not just change stores.
I believe this is a genuine proprietary ecosystem. Layered on top of this is a growing services ecosystem; VIP Petcare’s in store veterinary clinics, now brought fully in house, alongside Allivet’s pharmacy and expanding Garden Center formats. Each of these deepens the reason a customer drives to a physical Tractor Supply store rather than defaulting to whatever is cheapest or fastest online.
The Company deepens this ecosystem further by hiring locally, drawing its store teams from the same rural and exurban communities it serves, and this local hiring practice reinforces the moat in three distinct ways.
The first is genuine local knowledge; employees drawn from the surrounding area often share the exact hobbies and occupations as the customers walking through the door, and a team member who owns horses or maintains a hobby farm can give authentic, practical advice on specific livestock feed formulas, fencing types, or small tractor parts, an authoritative sales environment I do not believe a generic retail giant can easily replicate.
The second is community-led trust; in a small town market, shopping at a store staffed by recognizable neighbors, relatives, or a local high school sports coach creates a kind of brand equity that elevates Tractor Supply from a transactional storefront to a reliable community anchor, reinforcing the “dependable supplier” positioning this entire section describes.
The third is operational; employees who live within the town they work in generally have shorter commutes and report higher job satisfaction than long distance commuters, and hiring people already familiar with agricultural or rural living meaningfully lowers the time and cost required to train staff on complex, technical product categories. I view this local hiring model as a genuine extension of the trust this ecosystem depends on.
While standard big-box retailers often face significant customer churn, Tractor Supply’s Neighbor’s Club loyalty program shows some of the stronger retention figures the Company has disclosed. Approximately 75% of members remain active in the program year over year, and retention rises to over 90% among the Company’s highest-spending tier, the core hobby farmers and livestock owners purchasing premium feed and heavy equipment on a recurring basis. I believe this reflects the same needs-based purchasing pattern discussed elsewhere in this report; livestock feeding schedules and property maintenance needs recur on a fixed cycle regardless of season or sentiment, giving Tractor Supply’s most valuable customers a structural reason to keep returning that a discretionary or fashion-driven retailer does not have. This retention data is, in my view, the clearest proof that the ecosystem described above, loyalty, private label, services, and local hiring together, is functioning as intended.
Evidence of the Moat
The clearest evidence, in my view, is longevity and consistency; 30+ consecutive years of revenue growth, a five year net sales CAGR of approximately 7.9%, and a gross margin that has held in a narrow, gradually improving band, 35.4% to 36.4%, across a period that included a pandemic demand shock, a sharp normalization, tariff pressure, and an aggressive store expansion program. I do not believe a business without real pricing power and genuine customer stickiness holds gross margin steady through that sequence of shocks.
Moat Trajectory
I read the moat as being extended. The VIP Petcare acquisition brought an existing in store veterinary clinic network, already operating in 1,700 Tractor Supply locations as a retail partnership, in house alongside Allivet’s pharmacy and the Neighbor’s Club program. Management has described the combination as an end to end pet care offering spanning veterinary services and pharmacy, built in what the Company itself calls a capital efficient, asset light manner. I believe this is exactly the kind of adjacency expansion that deepens a needs based moat rather than diluting it, provided integration is executed well, a qualification I return to in the Risks section given how recent the acquisition is.
The Final Mile delivery buildout described in the second moat pillar is doing the same kind of work, extending the moat rather than merely defending it. As that network scales toward its stated goal of handling up to 95% of large-item deliveries in-house, I expect it to make the overall model stickier in two distinct ways.
First, a customer who receives a heavy, awkward item like fencing or a riding mower delivered directly, rather than having to haul it themselves, has a materially better experience than the “bring your own truck” model this Company operated under for decades, and I believe that improved satisfaction compounds into exactly the kind of retention already visible in the Neighbor’s Club data discussed above.
Second, and just as important, it raises the bar for anyone trying to compete with Tractor Supply on its own turf. A regional competitor without a comparable hub network cannot match this delivery experience without absorbing years of infrastructure investment first, and a national e-commerce competitor still faces the same structurally unfavorable shipping economics for heavy goods that this moat pillar describes, only now facing a Tractor Supply that has closed its own weakest point rather than left it exposed. I view this as the moat’s most active front of expansion, converting what was until recently a genuine vulnerability into a further reason for competitors to stay out.
Competitive Landscape
Tractor Supply’s competitive set spans several distinct categories rather than a single direct rival: regional farm and ranch chains (Rural King, Fleet Farm, Blain’s Farm & Fleet, Bomgaars, Atwoods), none of which are publicly traded or operate at comparable national scale; home improvement giants (Home Depot, Lowe’s, Menards) that overlap on tools, fencing, and lawn care but do not share Tractor Supply’s rural lifestyle focus or store format; pet specialty retailers and e-commerce (Chewy, PetSmart, Petco) that compete for companion animal spend; and mass merchants and Amazon competing on price and convenience for commodity items. I do not see a single competitor that matches Tractor Supply’s specific combination of rural geographic density, needs based product mix, and now in house veterinary services. The absence of a single dominant challenger across four decades is itself evidence, in my opinion, that this specific niche is harder to contest than it looks from the outside.
3. Financial Performance
The Revenue Story: Why the Base Year Matters
I want to lead with revenue, because I believe every other line in the income statement, all the way down to net margin and ROIC, only makes sense once the revenue story is understood correctly.
Comparable store sales exploded in 2020 and 2021. In 2020, comps grew 23.1%. In 2021, they grew another 16.9% on top of that. This was not ordinary retail execution. It was driven by urban to rural migration, a surge in pet adoption, and a wave of new hobby farming during a period when Americans were spending far more time and money at home. This two year stretch permanently raised Tractor Supply’s revenue base to a structurally higher level than it had ever operated at before.
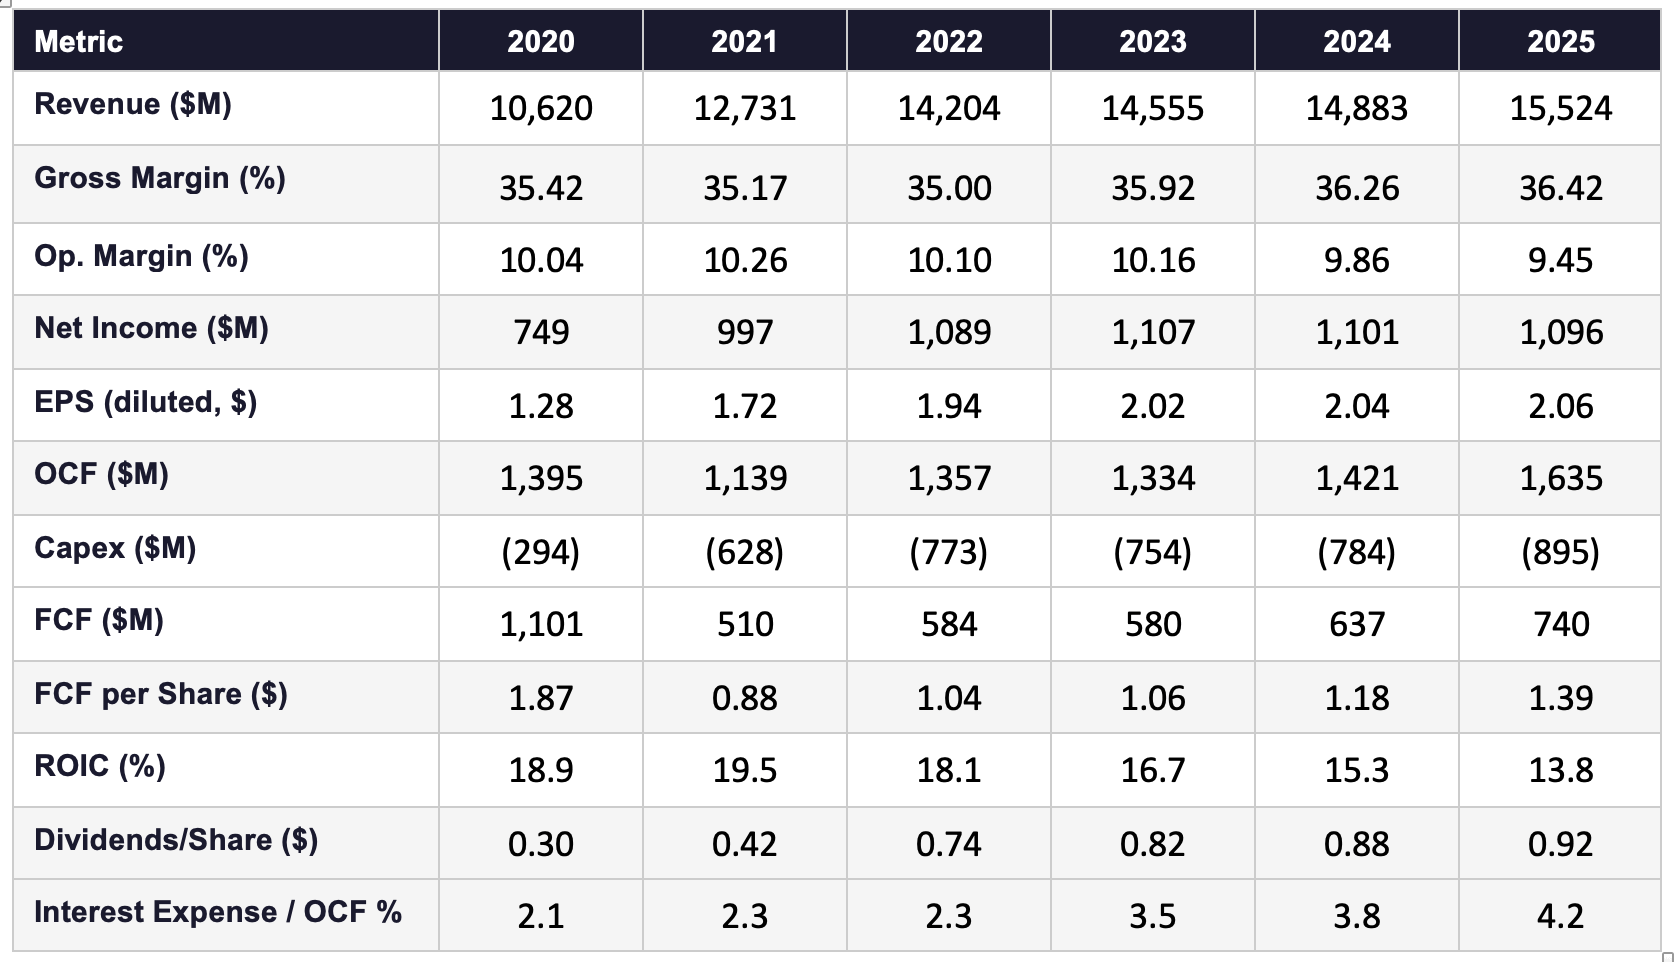
Here is the table that tells the story:
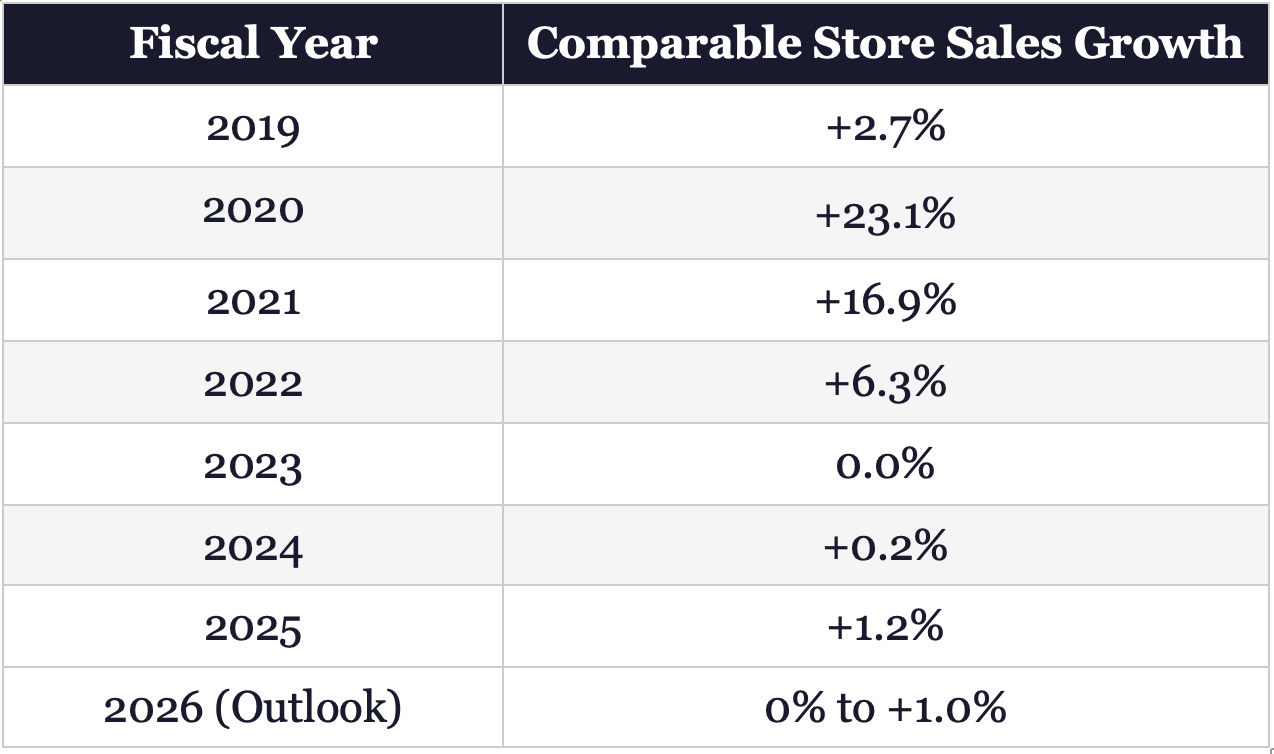
Look at what happens after 2021. Every year from 2022 onward is being measured against a base that is already roughly 40% higher than it was in 2019, because that is the combined effect of the 2020 and 2021 spikes compounding on top of each other. When a retailer grows 23% and then 17% in consecutive years, the following years cannot simply repeat that pace. There is no natural mechanism for a rural farm and ranch retailer to grow another 20% on top of an already 40% higher base.
What I believe actually happened is this; Tractor Supply successfully defended the new, much larger revenue baseline it had won during the pandemic, rather than losing that baseline once the impulsive, one time demand for new chicken coops, new fencing, and new pets receded.
A flat or barely positive comp print in 2023 and 2024, against that elevated base, is a business holding onto nearly all of an extraordinary, one time gain in its customer base, and then adding a modest amount of further growth on top of an already much larger number. I consider this a genuine achievement, not a warning sign, even though at first glance a 0.0% comp print looks like stagnation.
How the Revenue Story Flows Through the Income Statement
Once the revenue base is understood this way, the rest of the story follows logically, line by line.
Gross margin has actually improved, from 35.42% in fiscal 2020 to 36.42% in fiscal 2025, a genuine gain of 100 basis points. It reflects two direct initiatives I believe deserve credit; the expansion of exclusive, higher margin private label brands, which bypass third party markups and now represent roughly 30% of total sales, and supply chain efficiencies from the Company’s growing distribution network, including lower ocean freight costs compared to pandemic era peaks. Cost of goods sold as a percentage of sales has fallen steadily across the last decade, from roughly 65.6% in 2015 to 63.6% in 2025. This is the part of the business that management directly controls, and it has executed well.
SG&A as a percentage of sales, however, has risen even faster, from approximately 22.0% in 2015 to 23.8% in 2025. This is where the revenue story becomes the cost story. A retail store carries largely fixed costs, rent, base staffing, utilities, management salaries, regardless of whether comparable sales grow 20% or 0% in a given year. During 2020 and 2021, the explosive comp growth diluted those fixed costs across a rapidly growing sales base, and it also helped fund the continued opening of new stores and the remodeling of existing ones through Project Fusion.
Once comps normalized to flat or barely positive from 2022 onward, that dilution effect disappeared, while the Company continued opening new stores and continued remodeling existing ones at a similar pace. New, unmatured stores carry higher SG&A as a percentage of their own sales until they reach the productivity of the mature chain average, and that drag has been compounding across roughly 490 net new stores over the past five years and 99 new stores in fiscal 2025 alone. Layered on top of that is straightforward wage inflation across the retail sector, which the Company has had to absorb to remain competitive for labor in rural markets.
Operating margin is where these two forces net out, and I want to state plainly what the data shows: gross margin expansion of roughly 100 basis points over five years has been more than offset by SG&A deleverage, and operating margin has compressed from a peak of 10.26% in fiscal 2021 to 9.45% in fiscal 2025. The gross margin wins were real. They were simply not large enough to absorb the fixed cost burden of continued store growth against a comp sales backdrop that, for entirely explainable reasons rooted in the 2020 and 2021 spike, is not growing fast enough yet to fully dilute that overhead.
Net income and ROIC are the final destination of this same story. Net income was effectively flat in fiscal 2025 at $1.096 billion versus $1.101 billion in fiscal 2024, with diluted EPS up modestly to $2.06 from $2.04, aided by share buybacks. ROIC, by my own methodology, net operating profit after tax divided by total assets less goodwill, accrued liabilities, and cash, has declined in each of the past four years: 19.5% in 2021, 18.1% in 2022, 16.7% in 2023, 15.3% in 2024, and 13.8% in 2025. Even after this compression from its pandemic era peak, ROIC remains well above the Company’s cost of capital, meaning every dollar of the elevated capital program discussed below is still being invested at a real, positive spread over what it costs the Company to raise that capital.
I believe this decline is the compounded effect of the exact same dynamic described above, continued capital deployed into new stores, remodels, and now distribution capacity and bolt on acquisitions, at a pace that has outrun the rate at which post pandemic comparable sales growth is expanding the earnings base.
My conclusion is that once comparable sales growth returns closer to the low single digit range, the same fixed cost base that is currently a drag becomes a source of leverage again, and I expect margins and ROIC to move back toward their historical range. This recovery is likely to be delayed, however, given the heavy capital expenditure and remodeling costs still working through the system, discussed in detail below.
Why Capital Expenditure Rose After 2020, and How That Flows Into ROIC
Capital expenditure as a percentage of revenue stepped up meaningfully starting in 2021, from roughly 3% of revenue in 2020 to a sustained 5% to 6% from 2021 through 2025. I believe four distinct initiatives explain this, and I want to walk through each one rather than treat elevated capex as an unexplained drag.
The first is Project Fusion, a multi year program to completely overhaul the interior layout of existing stores, reconfiguring floor plans, improving lighting, and optimizing space for higher margin goods. This is a real, ongoing capital commitment across a store base of more than 2,600 locations, not a one time expense.
The second is the Side Lot Garden Center expansion. Tractor Supply capitalized directly on the wave of Americans moving to rural areas during the pandemic by converting the exterior space of its stores into secure, climate sheltered outdoor structures for live plants, lawn goods, and garden equipment, now numbering approximately 700 locations. Building physical, localized infrastructure store by store is inherently capital intensive.
The third is supply chain infrastructure. The explosive sales volume growth of 2020 and 2021 exposed real bottlenecks in the Company’s fulfillment network, and Tractor Supply responded by building next generation, automated regional distribution centers, including facilities in Ohio and Arkansas among its ten current distribution centers, to sustain high in stock rates for heavy, consumable goods like livestock feed. The Nampa, Idaho facility now under construction is a continuation of this same investment cycle.
The fourth is omnichannel and digital investment. The rapid scaling of e-commerce demand during this period forced genuine capital investment into digital architecture, including the Company’s mobile app, buy online pickup in store infrastructure, and inventory tracking technology.
I believe the mechanism connecting this capital program to the ROIC decline operates through three channels.
First, capital expenditure flows directly onto the balance sheet and expands the invested capital base immediately, while major projects like automated distribution centers and full store remodels take real time to ramp up to their intended productivity, a straightforward timing lag between cash outlay and earnings contribution.
Second, launching initiatives at this scale creates upfront operational drag, store downtime, staff retraining, project management, and pre-opening logistics, that hits the income statement immediately and compresses operating margin before the investment reaches its full efficiency, which lowers the earnings numerator in the ROIC calculation in the near term.
Third, Tractor Supply’s capital profile before 2021 was comparatively asset light, resting on an older, largely depreciated store base. Anchoring meaningfully more capital into physical real estate, distribution mega hubs and permanent garden center structures, has lowered the Company’s overall asset turnover, and generating less revenue per dollar of fixed physical plant naturally pressures ROIC downward even when the underlying investments are sound.
Free Cash Flow
Free cash flow per share requires the same careful read of the base period as revenue does. Fiscal 2020’s figure of $1.87 per share was distorted by COVID era dynamics, compressed capital spending and unusual working capital swings, and is not a representative starting point. Measured from fiscal 2021, a cleaner base year, free cash flow per share grew from $0.88 to $1.39 in fiscal 2025, a compound annual growth rate of approximately 12%. I consider this real, meaningful growth, achieved despite an elevated capital expenditure program funding new stores, remodels, and distribution capacity, and it is the figure I anchor to, not the distorted 2020 to 2025 comparison.
Capital expenditure rose from $784 million in fiscal 2024 to $895 million in fiscal 2025, consistent with the accelerated store opening pace and the Nampa distribution center build described above.
Balance Sheet
Total funded debt stood at $1.765 billion at the end of fiscal 2025: $750 million in 5.25% Senior Notes due 2033, $650 million in 1.75% Senior Notes due 2030, $150 million in 3.70% Senior Notes due 2029, and $230 million drawn on the revolving credit facility. The Company carries an investment grade credit rating, Baa1 from Moody’s and BBB from Standard & Poor’s, both stable outlook, and was in compliance with all debt covenants as of fiscal year end. Separately, the balance sheet carries approximately $4.14 billion in operating lease liabilities. This figure reflects standard retail lease accounting for the Company’s store footprint, not funded borrowing, and I do not conflate it with financial debt when assessing leverage. Cash and equivalents were $194.1 million at fiscal 2025 year end.
Working Capital
Inventory days tell a reversion story, not a deterioration story, once the pre-pandemic period is included. From 2015 through 2019, inventory days ran between 106.3 and 108.7, a stable band comfortably above 100 days. In 2020 and 2021, inventory days fell sharply to 90.1 and 87.9, as the explosive demand spike discussed above pulled inventory off the shelves faster than it could be replenished. From 2022 onward, inventory days climbed back toward their historical norm: 96.9 in 2022, 104.8 in 2023, 105.5 in 2024, and 109.6 in 2025, a level essentially identical to where the Company sat every year from 2015 through 2019. I do not read this as a new or abnormal buildup. I read it as the inventory position normalizing back to where it always sat before the pandemic temporarily depleted it. The cash conversion cycle shows the same pattern, and I see nothing in this data that concerns me on its own.
4. Growth Levers & Addressable Market
A) Continued Store Growth
The Company opened 99 new Tractor Supply stores in fiscal 2025 and plans approximately 100 more in fiscal 2026, continuing a steady expansion pace that has run since 2019: 80 new stores in 2019, 80 in 2020, 80 in 2021, 63 in 2022 alongside the acquisition of 81 Orscheln Farm & Home locations that same year, 70 in 2023, 80 in 2024, and 99 in 2025. As part of its Life Out Here 2030 strategy, management had set a long term domestic store count target of 3,200 Tractor Supply locations, raised from a prior target of 3,000. Against 2,395 stores at the end of fiscal 2025, that target implied roughly 800 additional stores of disclosed, management endorsed runway ahead of the Company at its current pace of expansion. Following its second quarter fiscal 2026 results, management withdrew this long-term financial framework and indicated an updated framework will be provided alongside fourth quarter fiscal 2026 results, so this figure should be treated as a prior target pending replacement.
B) Existing Store Sales Growth
Comparable store sales, the growth in existing, already mature stores, is its own distinct lever, and I believe it is the one most directly tied to the operating leverage discussion in the Financial Performance section above. The Company’s original fiscal 2026 guidance called for comparable store sales growth of 1% to 3%, since revised downward following second quarter results to a range of flat to 1%. I continue to expect that once comparable sales normalize, a 1% to 3% growth range is achievable on a sustained basis, and I view this as a genuine re-acceleration lever in its own right, separate from and additive to new store openings. Once the Company returns to that range, I expect it to translate directly into the kind of fixed cost dilution that would meaningfully help operating margin and ROIC recover, given everything discussed above about how SG&A deleverage has been driven by a normalizing comp base.
C) Pet Care Vertical Integration
The combination of Allivet, acquired December 2024, and VIP Petcare, acquired May 2026, gives Tractor Supply a genuinely differentiated, end to end pet care, offering pharmacy and veterinary services under one roof, anchored by the Neighbor’s Club loyalty program. Companion Animal already represents 24% of net sales. I believe that if integration is executed well, this vertical has real room to grow both same store spend per pet owning customer and overall customer stickiness, since a customer using in store veterinary care has a meaningfully higher switching cost than one simply buying commodity pet food.
D) Digital Convenience Without Abandoning the Core Model
The Company’s approach to digital and delivery, renting fast, light-parcel convenience through partners like Instacart while building and controlling the harder, heavy-freight problem in-house through Final Mile, is discussed in full in the Moat section above. Direct Sales, launched in fiscal 2025 and targeting larger and more complex B2B style purchases, is a related, still early stage initiative, and the Company has not yet disclosed specific revenue contribution from it.
E) Loyalty Data
Neighbor’s Club, at more than 80% of sales, is both a moat pillar and a growth lever. It gives management a live view into customer purchasing patterns that can inform localized assortment, targeted promotion, and personalized digital engagement, without requiring incremental store level capital.
What I Conclude
Store growth is a continuation of an established, repeatable process. Pet care integration is a real, if recent, strategic bet with a plausible payoff in customer stickiness. Instacart, Direct Sales, Final Mile, and loyalty data are lower capital, still developing levers that management has flagged but not yet proven at scale. I read this as a business with several credible, non speculative paths to continued growth, rather than one dependent on any single initiative succeeding.
5. Management
Leadership and Tenure
Harry A. Lawton III has served as President and CEO since January 2020, with prior senior leadership roles at Macy’s, eBay, and Home Depot. In November 2025, the independent members of the Board approved a retention equity award to Lawton with a target grant value of $20 million, 60% performance share units tied to five year relative total shareholder return, 40% time based restricted stock units vesting on a back loaded schedule through 2030. The award was explicitly designed for retention through the Company’s Life Out Here 2030 strategic horizon, in a market the Compensation Committee described as competitive for proven retail chief executives. I read an award of this size, granted outside the Company’s normal annual compensation cycle, as a genuine signal of Board confidence in current leadership continuing to execute the strategy discussed throughout this report, not a routine event.
Under Lawton’s leadership the Company has made two notable bolt on acquisitions in successive years, Allivet in December 2024 and VIP Petcare in May 2026, both deepening the same pet care vertical rather than diversifying into unrelated categories. I consider that a coherent, additive pattern of capital deployment, not scattered dealmaking.
Capital Allocation Track Record
The Company returned approximately $848.5 million to shareholders in fiscal 2025 through buybacks and dividends. In February 2026, the Board raised the quarterly dividend to $0.24 per share, an annualized $0.96, marking the 17th consecutive year of dividend increases. $1.13 billion remains authorized under the Company’s $7.5 billion share repurchase program. Set against this, capital expenditure has risen materially, from $784 million to $895 million year over year, reflecting a deliberate tilt toward reinvestment, new stores and distribution capacity, over incremental buybacks in the current period. I consider this the correct capital allocation choice given the returns the store growth program has historically generated, and I would want to see it reflected in a stabilizing ROIC over the next one to two years.
6. Valuation
The future return on Tractor Supply stock is a function of two engines: the future growth in free cash flow per share and any valuation re-rating. Both are explained below:
Engine 1: Fundamentals
The first engine is the business itself. FCF per share grows over time through revenue expansion, operating leverage, and share count reduction from buybacks. That growth, compounded annually, is what the fundamental engine delivers regardless of any valuation re-rating.
For Tractor Supply, I assume a gradual acceleration in FCF per share growth over the projection period until it reaches 8% to 9% annually, rather than applying that rate uniformly from the start. The primary driver is continued store growth, roughly 100 new stores a year against a previously disclosed long-term target of 3,200 locations, now under review following the Company’s withdrawal of its long-term framework, compounding on top of a comparable store sales base that I expect to gradually re-accelerate toward the low single digits. Margin recovery is the second component of this growth rate, as the gross margin gains from private label expansion and supply chain efficiency, already real and demonstrated over the past five years, begin to flow through to operating margin once comparable sales growth dilutes the Company’s fixed cost base again. Buybacks add a further per-share amplification effect as the diluted share count declines.
I also expect free cash flow conversion to improve further as the current elevated capital expenditure cycle cools. Project Fusion remodels, the Side Lot Garden Center rollout, and the current distribution center build-out, including Nampa, are each maturing, finite programs rather than permanent step-ups in the Company’s capital intensity. As they complete and capital expenditure normalizes back toward its historical share of revenue, a larger share of operating cash flow should convert directly to free cash flow without a corresponding reinvestment offset, a tailwind to the fundamental engine on top of the growth rate assumption itself.
Engine 2: Valuation Re-Rating
At today’s price of approximately $29.4, the investor is paying for everything this business will earn over roughly the next 17 years, in today’s money. Everything it earns beyond that point comes to the investor at no additional cost. The fewer the embedded years, the more of the future the investor receives without paying for it.
At 17 embedded years, the price sits in the Attractive zone on my own valuation scale, a level Tractor Supply has rarely occupied across its history as a public company. This is a price shaped substantially by a genuine, if overstated, market reaction to decelerating comparable sales and compressing margins, both of which I addressed directly and at length in the Financial Performance and Risks sections above.
Tractor Supply’s own stock traded at more than three decades of embedded years at its 2025 peak of $63. Getting back even partway toward a more ordinary premium, well short of that peak, would represent a meaningful valuation tailwind on top of the fundamental engine described above.
At 17 embedded years, I believe both engines are working in the investor’s favor here, a genuinely growing free cash flow base compounding through continued store growth and margin recovery, and a valuation that has moved from one extreme to the other in the span of a single year without the underlying business changing nearly as much as the price did.
7. Risks
1. Companion Animal Softness and Pet Care Integration Risk
Management explicitly flagged companion animal as underperforming the Company average in the first quarter of fiscal 2026, citing softer demand trends, category shifts, and an unfavorable product mix, and stated it is “taking decisive actions to improve its performance” without detailing what those actions are. In the second quarter, the Company followed through with a concrete action, restructuring its Petsense banner and closing approximately 75 of its 209 stores, recording a $65.8 million impairment and restructuring charge in the process. I take this risk seriously because Companion Animal is 24% of net sales, the second largest category, and because the Company has now made two consecutive acquisitions, Allivet and VIP Petcare, specifically to strengthen this vertical.
My own read of the Petsense closures, is that this represents a deliberate pivot away from low-margin, low-differentiation standalone pet retail, generic pet food and supplies that Chewy, PetSmart, and Petco can match or undercut on price, and toward the higher-margin veterinary services now offered through VIP Petcare, integrated directly into the Company’s higher-traffic core Tractor Supply stores. If that reading holds, this is Tractor Supply choosing to concentrate its pet care capital into the part of the category genuinely resistant to e-commerce competition. I want to see this confirmed by management commentary before treating it as established strategy, but I view it as the more likely explanation given the timing alongside VIP Petcare’s integration.
The recency of the VIP Petcare acquisition means there is no operating track record yet on integration execution, and an acquisition described as “capital efficient” and “asset light” still carries real execution risk in bringing an outside veterinary services workforce and clinic operation in house, now compounded by a simultaneous restructuring of an adjacent banner. The mitigation, in my view, is that the Company is not simply talking about this weakness, it has made three direct actions in relatively quick succession, the Allivet acquisition, the VIP Petcare acquisition, and the Petsense restructuring, all pointing in the same strategic direction. That consistency gives management real tools to address the softness rather than relying on hope alone, though it also means more moving pieces to integrate successfully at once.
2- Weather and Seasonality Risk
A large share of Tractor Supply’s inventory is seasonal, and the Company’s own filings state that sales and profits are historically highest in the second and fourth fiscal quarters. A late, cold, or unusually wet spring damages sales of live poultry, lawn and garden equipment, fencing, and fertilizer. A mild winter eliminates urgent demand for wood pellets, heating stoves, snow removal gear, and heavy winter workwear. The mitigation here is the Company’s needs based product floor, feed, pet food, basic maintenance supplies, which I believe provides a genuine partial offset, since that demand is recurring rather than seasonal, even though it does not fully insulate results from a genuinely unusual season.
3- Commodity and Supply Chain Cost Exposure
Tractor Supply’s business model relies on bulky, heavy items, animal feed, horse bedding, fencing, that carry high distribution and transportation overhead. Severe fluctuations in corn, soy, and grain pricing directly affect the manufacturing cost of livestock feed, and I believe this squeezes margin whenever those costs cannot be passed through to a cash strapped rural customer. Because of the heavy physical footprint of what the Company ships, sudden spikes in diesel fuel and domestic shipping rates rapidly drive up baseline cost of goods sold. The mitigation is twofold: the expansion of exclusive private label brands, already a meaningful driver of the gross margin improvement discussed above, reduces dependence on third party brand markups and gives the Company more direct control over sourcing, and the Company’s continued localization of regional distribution centers, including the new Nampa, Idaho facility, shortens the distance between distribution nodes and storefronts, which I believe partially insulates it against future freight volatility, though I have not seen this quantified by management.
4- Rural Consumer and Demographic Concentration Risk
Tractor Supply’s core customer base is intensely concentrated in rural communities, which makes the business dependent on the localized economic health of American agriculture. When net farm income declines, whether from falling federal agricultural subsidies or cratering crop prices globally, I believe rural discretionary spending on non essential tools, trailers, and apparel freezes quickly, well before spending on the needs based C.U.E. floor is affected. Separately, some portion of Tractor Supply’s pandemic era growth was plausibly tied to the migration of urban workers into rural areas and a resulting wave of hobby farming.
If hybrid workers who moved during the pandemic return to major metropolitan areas at scale, I believe the hobby farming customer pipeline that has partly fueled the Company’s elevated post pandemic baseline could contract, though I have no way to quantify this risk precisely with current disclosure. The mitigation is the Company’s Neighbor’s Club data, which gives management real time visibility into shifting customer spending priorities and the ability to respond with targeted promotion faster than a retailer without a comparable loyalty program.
8. The Verdict
Tractor Supply is the largest player in a niche it has spent 85 years building and largely owns; rural lifestyle retail, in towns and markets too small for a Home Depot, Lowe’s, or Walmart to profitably enter. That leadership position has not weakened. What has happened is a normalization after an extraordinary, unrepeatable two year surge in demand during the pandemic, layered on top of a period of unusually high capital expenditure funding store remodels, garden center expansion, distribution infrastructure, and technology investment.
The stock has been beaten down as if this combination represented deterioration. I believe the market has read it backwards. A flat or barely positive comparable sales print in the years following a 23% and then 16.9% spike is a business that successfully defended an extraordinary, one time gain in its revenue base rather than giving it back, which I consider a genuine strength once the base year is properly understood, not the warning sign a surface level read of recent comp prints suggests. The elevated capital spending sitting alongside that normalization is the ordinary cost of a decades long, still-running growth playbook, remodeling stores, building distribution capacity, and investing in the digital and pet care capabilities that extend the moat, continuing at a scale that a slower post pandemic sales backdrop has made more visible and, for now, more expensive to carry.
None of this changes what Tractor Supply fundamentally is; the largest, most entrenched rural lifestyle retailer in the country, with a needs based product core, a real and growing loyalty and pet care ecosystem, and a store growth runway still years from exhausted. I believe the fundamentals here are intact, and that the price today reflects a market mistaking a normalization story for a structural one.
The author does not hold a position in Tractor Supply, Inc. at the time of publication. This report reflects the author’s personal views and is not investment advice. Investing carries the risk of permanent capital loss. Read full disclosure here.
Quarterly Update Log
This section is updated with each subsequent quarterly result and is kept separate from the annual analysis above, which reflects the fiscal 2025 full year record.
Q2 Fiscal 2026 (reported July 23, 2026)
Net sales increased 2.3% to $4.54 billion. Comparable store sales decreased 1.5%, with positive results in April and June offset by a weaker May. Adjusted diluted EPS was $0.81, flat compared to $0.81 in the second quarter of 2025, with reported diluted EPS of $0.69 reflecting a $65.8 million impairment and restructuring charge tied to the planned closure of approximately 75 Petsense stores, alongside VIP Petcare acquisition costs. The Company updated its full year guidance downward and withdrew the long-term financial framework introduced at its December 2024 Investor Day, indicating an updated framework will accompany fourth quarter results.
This quarter includes real one-time items, the Petsense restructuring and acquisition costs, that make the headline numbers noisier than usual, and I’ll let the picture clarify over the next few quarters before drawing any conclusions from it.