

The information on this page was last updated on August 10, 2026
We approach investing with the mentality of finding a few super-quality companies with predictable future cash flows, selling at what we believe to be a bargain. Finding these rare companies takes months of research: filtering the market, excluding the vast majority of traded businesses, and selecting the very few that meet our strict quality filter. Of these few, we then select those with favorable valuation, which increases the odds of generating a return on investment beyond what the company’s fundamental growth rate alone offers.
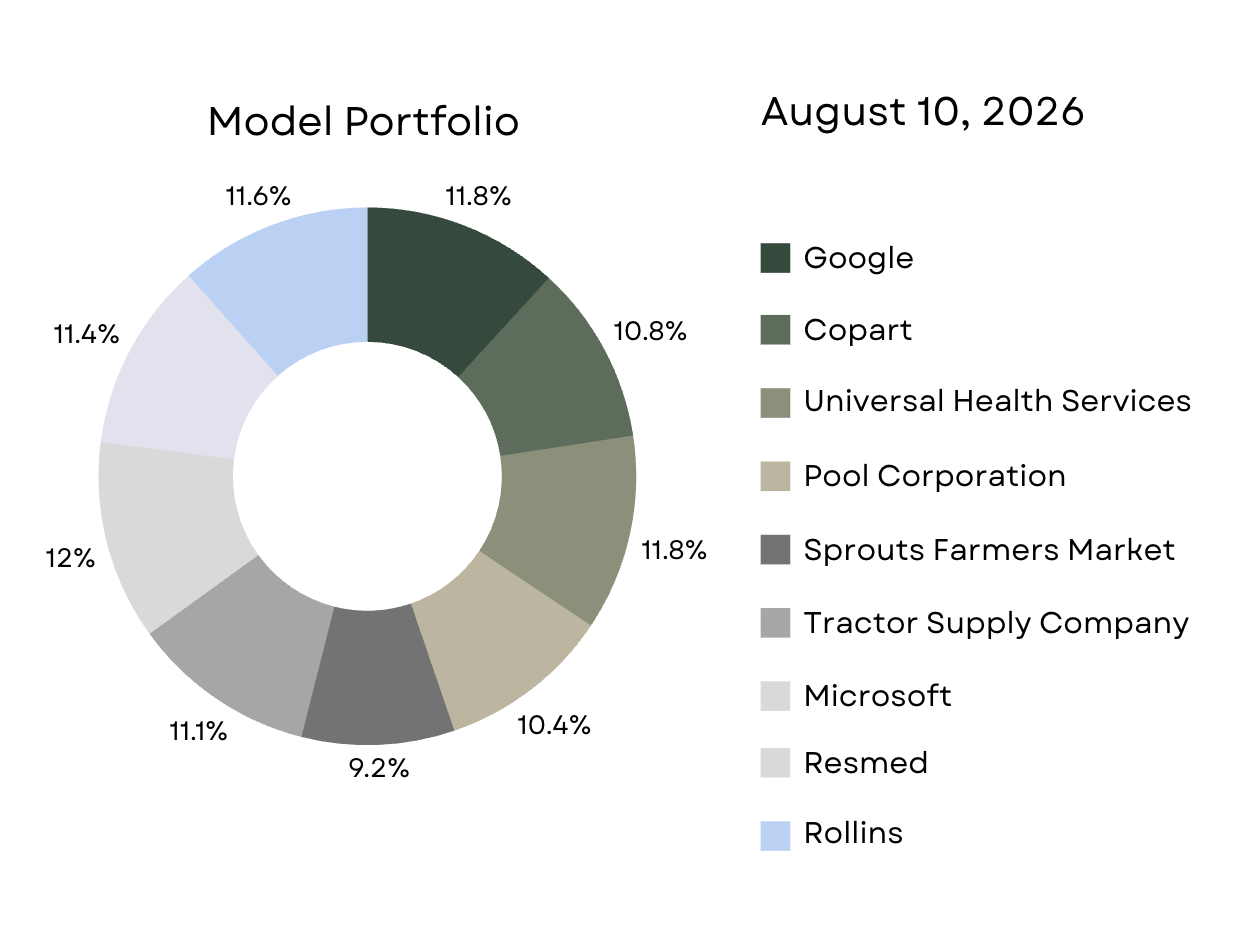
This page tracks our model portfolio. It is a monthly record of our highest-conviction names from the research library. The portfolio is modeled on a notional $100,000 starting value and is currently allocated across 9 names. The first position was initiated on July 16, 2026.
Our approach revolves around optimal capital allocation. We hold quality businesses when they trade at a favorable valuation, offering a genuine margin of safety, and we sell them when the valuation becomes unfavorable, redeploying that capital into another quality business trading at a more attractive price. Every open position could take months or years to close, depending on what the market offers.
As a general rule, we exit positions when the original thesis breaks or when a name’s valuation is no longer favorable relative to its quality and growth.
We publish a monthly update on portfolio positions, valuations, and any changes to subscribers.
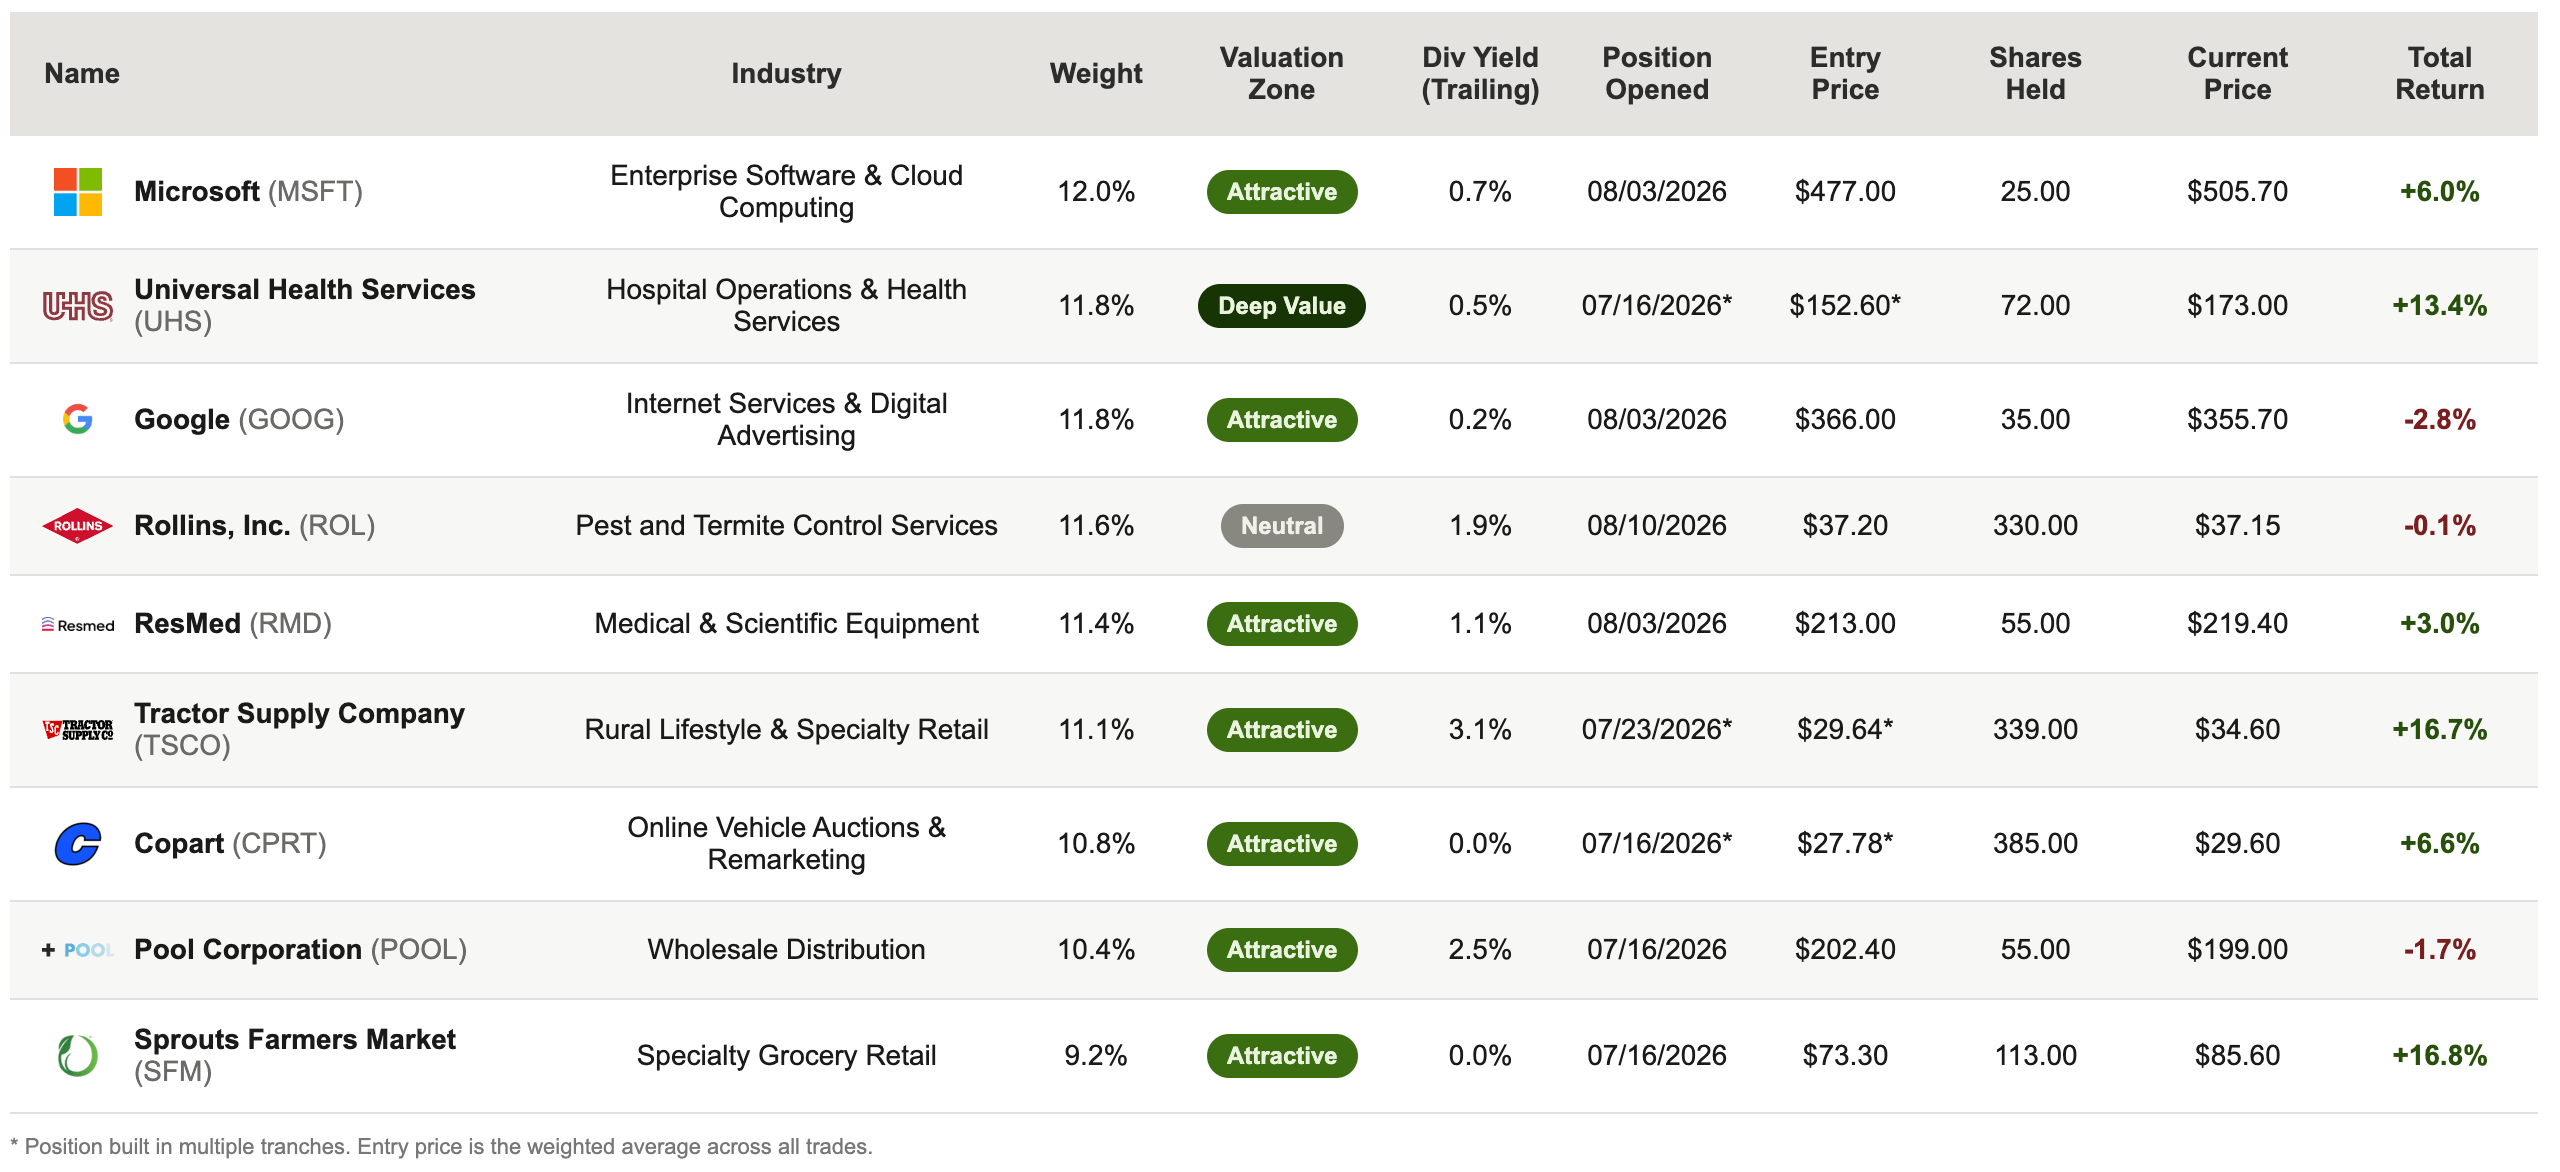
Portfolio Return Since Inception (July 16, 2026 - August 10, 2026) is +5.6%
S&P Return between July 16, 2026 - August 10, 2026 is +3%
Total Portfolio Value: $105,633 (starting from $100,000)
This reflects the total return of the model portfolio, since its first position was added. It does not reflect the return of any individual investor, whose results will vary based on entry timing and position sizing.
The chart below shows the current composition of the Model Portfolio, each position's share of total capital, and the portion still held in cash awaiting deployment, if any.
The table below is the full record, showing entry date and price, current price, dividend yield, total return per position since entry, and current valuation zone. This is the detailed version of the snapshot shown in the chart above.
it is worth mentioning that Wingstop has been moved from Approved to Watchlist and the position has been exited at a small loss.
The decision follows the second quarter results, which extended the streak of consecutive same-store sales declines to a point where the possibility of a structural demand issue can no longer be dismissed. What initially appeared to be a cyclical air pocket driven by weather disruption and a difficult prior year comparison is now showing enough persistence to warrant reassessment.
This model portfolio is for informational and educational purposes. It does not constitute personalized investment advice. Actual results for any individual investor will differ based on entry timing, position sizing, and the extent to which portfolio guidance is followed. Past performance does not guarantee future results.