

Under The Hood: Ulta Beauty, Inc. ($ULTA)
Company Analysis & Valuation

This report reflects the author’s personal views and is not an investment advice. Investing carries the risk of permanent capital loss. Read the full disclaimer here
The Outlook
Beauty is one of the few retail categories where the physical experience has not merely survived digital disruption, it has remained the primary reason consumers shop at all. You cannot match a foundation shade on a screen with confidence. You cannot know whether a fragrance suits you until you smell it on your own skin. You cannot replicate the trust of a stylist’s recommendation through a product carousel. Discovery in beauty is tactile, social, and advisory, and for thirty five years Ulta Beauty has been constructing the infrastructure to own that moment, and then to extend it, through digital and loyalty channels, into everything that comes after.
The founding insight, when Richard George and Terry Hanson opened the first store in Bolingbrook, Illinois in 1990, was that the beauty retail market had fragmented itself by price tier in ways that served the trade rather than the consumer. Prestige products lived behind department store counters, mass products in drug store aisles, professional products in authorised salons. A consumer who wanted all three made three separate trips. Ulta collapsed those occasions into a single destination: a large format store in a suburban strip centre, carrying prestige, mass, and professional products side by side, with a full service salon at the back. That structure, breadth across price tiers, embedded services, and a loyalty programme that converts every purchase into a data point, is what has been scaling for three and a half decades.
The loyalty programme, Ultamate Rewards, is the operational heart of the model. With more than 46 million active members and approximately 95% of all net sales flowing through the programme, Ulta has built something rare: a consumer franchise where the relationship between brand and customer is mediated almost entirely through a proprietary data layer the company controls. A member who discovers a moisturiser at an in store consultation, confirms it works, and then reorders it through the Ulta app is not just a repeat customer, she is a data point that improves the next recommendation, the next promotion, and the next brand partner negotiation. The guest who shops both in store and digitally spends, historically, more than three times as much as the store only guest. That pattern, in store discovery leading to digital replenishment, is the highest value expression of the model, and Ulta has built its entire commercial infrastructure around deepening it.
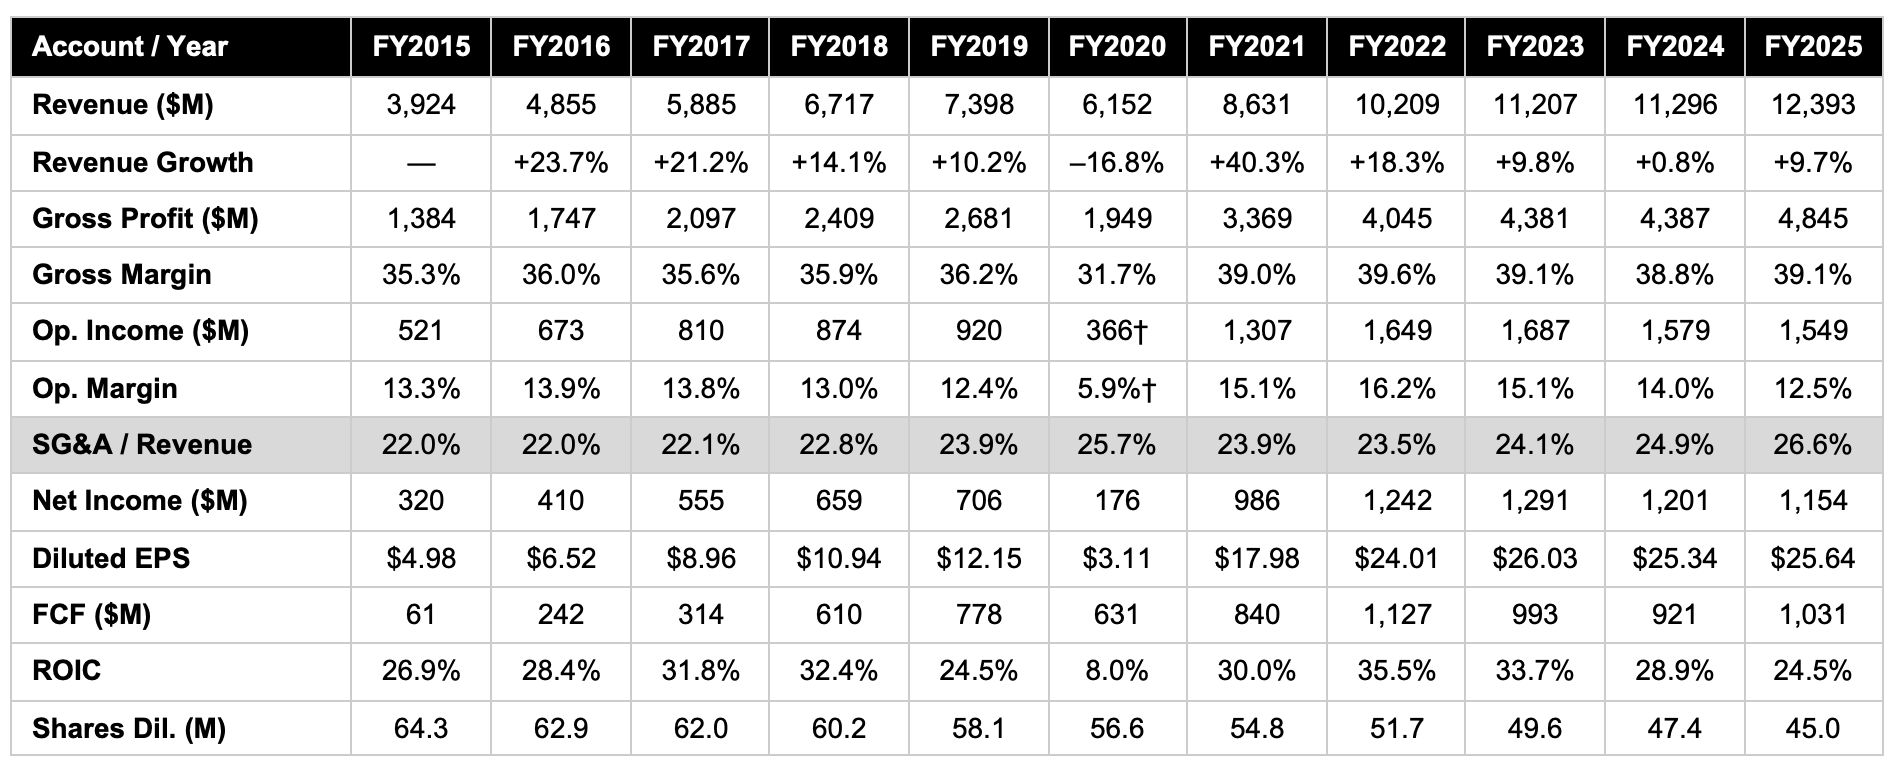
The financial record produced by this model is, for most of the decade between fiscal 2015 and fiscal 2025, impressive. Revenue compounded from $3.9 billion to $12.4 billion. Return on invested capital (ROIC) averaged above 27% through much of the period. Free cash flow per share grew from approximately $1 in fiscal 2015 to approximately $22.90 in fiscal 2025, driven by both genuine earnings growth and a consistent programme of share repurchases that reduced the diluted share count from 64.3 million to 45.0 million over the same period. These are the numbers of a business that earned genuine returns on incremental capital and allocated that capital with discipline.
But a financial record is a description of where a business has been, not a guarantee of where it is going. And what the most recent three fiscal years describe, fiscal 2022 through fiscal 2025, is a business whose absolute earnings and cash flow have stopped growing. Net income in fiscal 2022 was $1,242 million; in fiscal 2025 it was $1,154 million. Operating cash flow in fiscal 2022 was $1,482 million; in fiscal 2025 it was $1,503 million, marginally higher over three years, before adjusting for the cost of the capital that generated it. Meanwhile, selling, general and administrative expenses as a percentage of revenue have risen from 23.5% in fiscal 2022 to 26.6% in fiscal 2025, a consistent and multi year trend that this report examines closely.
The question this report attempts to answer honestly is whether these developments represent a transitional period in a business that will resume compounding, or an inflection in the underlying economics of a model that is approaching the limits of its domestic growth runway.
At approximately $558 per share and a market capitalisation of roughly $24.3 billion, the current price embeds approximately 46 years of future cash flows, a level that demands a confident view of the growth trajectory that the current evidence does not fully support. The analysis that follows is an attempt to be precise about what the business has demonstrated, what it has not, and what would need to change to make this a compelling investment.
At a Glance
Company: Ulta Beauty, Inc.
Ticker: $ULTA · NASDAQ
Sector: Consumer Discretionary
Industry: Specialty Retail — Beauty
Market Cap: $24.3 billion (at $558)
First Coverage: April 2026
FY2025 Revenue: $12.4 billion
1. The Business
Ulta Beauty was founded in Bolingbrook, Illinois in 1990 on the premise that the fragmentation of beauty retail by price tier was a structural inefficiency serving the trade more than the consumer. The founding format, a large format freestanding store in suburban strip centres, carrying prestige, mass, and professional products side by side, with a full service salon at the back, was unconventional at the time and has proven durable over three and a half decades. The company went public on NASDAQ in October 2007 and used the capital to fund national expansion. By fiscal 2016 it operated 974 stores; by fiscal 2025, 1,505 stores across all 50 states, alongside 86 Space NK stores in the United Kingdom and Ireland acquired in July 2025.
Ulta is a specialty beauty retailer, not a brand owner. It acts as the discovery and distribution platform between beauty brands and consumers, carrying approximately 30,000 products from approximately 600 established and emerging brands across every major price tier and category. The typical US store is approximately 10,000 square feet, with roughly 950 square feet dedicated to a full service salon offering haircuts, colour, blowouts, brow services, and skincare treatments. A smaller store prototype of 5,000 to 7,500 square feet is used for secondary markets. E-commerce and the mobile app, where approximately 60% of online sales originate, serve as replenishment and loyalty engagement channels, with omnichannel members spending historically more than three times as much as store-only members.
Beyond its branded assortment, Ulta offers its own private label brand, Ulta Beauty Collection, as well as a portfolio of third party brands sold exclusively at Ulta, either on a limited time basis or as longer term exclusives. Examples of exclusive brand partnerships include Cécred and Peach & Lily. In fiscal 2025, Ulta Beauty Collection and long term exclusive products represented approximately 4% of net sales; including short term exclusive products, the combined figure was approximately 11% of net sales. These exclusive relationships serve a dual purpose, they differentiate the assortment from competitors and generate higher merchandise margins than branded product sales at standard terms.
In fiscal 2025, cosmetics accounted for 38% of net sales, skincare and wellness 24%, haircare 19%, fragrance 13%, services 4%, and other 2%. The cosmetics share has declined modestly as skincare and fragrance have grown, reflecting broader category trends. Services, at 4% of revenue, carry strategic weight disproportionate to their financial contribution: a guest who schedules colour appointments returns on a predictable cadence, and the stylist relationship is among the most durable loyalty anchors in the store.
Ulta centrally manages product replenishment through a merchandise planning group that operates an open to buy system updated weekly with point of sale data, receipts, and inventory levels. As of fiscal year end 2025, the company operates four regional distribution centres, two market fulfilment centres serving both stores and e-commerce, and one fast fulfilment centre dedicated to e-commerce orders. More than 1,000 US stores participate in a ship from store programme. The market fulfilment centres, smaller, focused on the most productive SKUs, are designed to improve responsiveness in high density markets. This distribution infrastructure is the operational backbone of the omnichannel model and a genuine barrier to replication for any new entrant seeking to compete at comparable scale.
The Ultamate Rewards loyalty programme is the commercial engine of the business. With more than 46 million active members as of fiscal year end 2025, and approximately 95% of net sales flowing through it, the programme has achieved a penetration rate that is exceptional in specialty retail. Annual member retention exceeds 70%. The $582.4 million deferred revenue balance represents unredeemed points and gift cards, a forward commitment to return that is growing faster than the membership base itself. In fiscal 2025, 73% of loyalty members transacted exclusively in stores, reflecting the enduring primacy of the physical shopping occasion for Ulta’s core guest.
In July 2025, Ulta acquired Space NK, a luxury beauty retailer with 86 stores in the UK and Ireland, for approximately $399 million, funded with cash and short term credit. Space NK carries a premium, niche forward assortment in a smaller store format than Ulta’s US stores and is well regarded within the UK prestige beauty market. Beyond Space NK, Ulta operates a joint venture in Mexico with Grupo Axo (9 stores at fiscal year end 2025) and a franchise arrangement in the Middle East with Alshaya Group (2 stores). The international platform is financially immaterial relative to the US business, Space NK was acquired only partway through fiscal 2025, and will require sustained execution to justify the capital deployed.
2. The Moat
Ulta’s competitive advantage is a self reinforcing commercial ecosystem built on loyalty data, multi tier product breadth, in store experience, and physical density. The mechanism has been operating for three and a half decades without being successfully replicated at scale.
The mechanism works as follows. More loyalty members generate more purchase data, which enables more precise personalisation, which increases visit frequency and spend per visit. Higher spend per member justifies investment in brand exclusives and deeper category assortment, which attracts more brands seeking access to the member base. More brands and a stronger assortment attracts new members. A larger member base gives Ulta stronger leverage in brand partner negotiations, on terms, on exclusives, and on being selected as the launch partner for new product introductions. Each element reinforces the others, and because 95% of transactions flow through the loyalty programme, the data layer captures nearly the entire economic output of the business and converts it into competitive intelligence.
Pillar One
With 46 million active members and 95% of sales processed through Ultamate Rewards, Ulta operates one of the most comprehensive first party consumer databases in US specialty retail. The practical value of this data is in personalisation that an anonymous transaction retailer cannot approach, targeted replenishment reminders, predictive discovery prompts, shade matching recommendations informed by purchase history, and in the leverage it provides in brand partner relationships. A brand partner placing a new product at Ulta is not just accessing shelf space; it is accessing a targeted, purchase verified audience of 46 million beauty consumers. The deferred revenue balance of $582.4 million at fiscal year end 2025, growing 16.3% year on year, is the most direct financial expression of the programme’s deepening engagement: members are earning points at a faster rate than they are spending them, indicating commitment rather than attrition.
Pillar Two
No competitor carries prestige, mass, and salon professional products at scale under one roof. Sephora is prestige focused and carries no mass products or in store salon services at comparable scale. Mass retailers carry mass products but no credible prestige assortment and no services. Department store beauty counters offer prestige but operate as brand specific concessions rather than a multi brand discovery environment. Closing this gap requires simultaneously maintaining trust with prestige brands, who are historically reluctant to be shelved alongside mass products, and building the operational infrastructure to deliver a genuine salon service. Both are multi year relationship and investment commitments. Ulta’s exclusive and private label products deepen this moat further: approximately 11% of net sales flowing through exclusive or proprietary brands creates assortment that simply cannot be found elsewhere.
Pillar Three
The salon services business is embedded in almost every one of the 1,505 US stores. Its strategic importance is precisely its non replicability: no e-commerce platform, social commerce channel, or shop in shop concept can offer a colour appointment, a skincare consultation, or the relationship between a guest and a stylist she has seen three times. A guest who books salon appointments is not weighing Ulta against Amazon or Sephora, she is returning to a person and an experience. Company research confirms what the transaction data suggests: its guests prefer to transact in physical stores, where they can discover and interact with products and other beauty enthusiasts. The 73% of loyalty members who transacted exclusively in stores in fiscal 2025 are, in meaningful part, the guests for whom the physical experience is itself the value.
Pillar Four
With 1,505 stores across all 50 states, predominantly in high traffic suburban strip centres, supported by four regional distribution centres, two market fulfilment centres, one fast fulfilment centre, and more than 1,000 ship from store locations, Ulta operates a physical and logistics network that functions as both a retail asset and a fulfilment infrastructure. Building this network from scratch would require not just capital but years of lease negotiation, supplier relationship development, and market by market customer acquisition. The combination of physical density and distribution capability is the operational foundation of same day delivery, in store pickup, and ship from store, services that require the network to already exist before they can be offered.
Assessment
The core moat is intact. The loyalty programme is deepening, the exclusive brand relationships are growing, the salon service infrastructure remains non replicable, and the data advantage compounds annually. The moat is not, however, without pressure. Social commerce is compressing Ulta’s role at the top of the discovery funnel for younger consumers. Sephora’s expansion at Kohl’s has improved prestige accessibility in a mass retail format at over 1100 locations. These are real competitive dynamics, though they are pressures on the perimeter of the model rather than challenges to its structural core. My assessment is that the moat is stable, and that the more pressing questions for this business are about the cost structure and the growth runway, not the durability of the competitive position itself.
3. Financial Performance
Revenue
Ulta’s revenue between fiscal 2015 and fiscal 2025 divides into three periods. From fiscal 2015 through fiscal 2019, the business grew from $3.9 billion to $7.4 billion, a compound annual growth rate of approximately 17%, driven by new store openings at pace and comparable sales growth consistently in the mid to high single digits. Fiscal 2020 was the COVID interruption: stores closed for approximately eight weeks, comparable sales fell 17.9%, and revenue declined 16.8% to $6.2 billion. From fiscal 2021 through fiscal 2023, revenue recovered sharply, growing 40.3%, then 18.3%, then 9.8%, as pent-up demand, stimulus spending, and the structural step change in gross margins combined to produce exceptional three year period in the company’s history. Fiscal 2024’s growth of 0.8% reflected a normalisation of that demand cycle, and fiscal 2025’s 9.7% growth, driven partly by the Space NK acquisition from July 2025 and a genuine 5.4% comparable sales recovery, represents the current run rate. What the revenue trajectory does not show clearly, but the earnings and cash flow lines do, is that the revenue growth of fiscal 2025 did not translate into earnings growth.
Gross Margin
Gross margins from fiscal 2015 through fiscal 2019 were stable in the 35% to 36% range. Fiscal 2020’s 31.7% reflects the deleverage of fixed store costs on dramatically lower revenue during the COVID closure period, the one clear anomaly in an otherwise consistent record. From fiscal 2021 onward, gross margins moved into a structurally higher band of 39% to 40%, reflecting a greater mix of prestige and skincare products carrying higher merchandise margins, reduced shrink, and supply chain efficiencies. This shift has been sustained for five consecutive years and represents a genuine structural improvement in the gross economics of the product mix. Gross margins have not been the source of the profitability pressure that has emerged since fiscal 2022; they have been a source of stability.
Operating Margin and SG&A
Operating margins tell the more complicated story. From fiscal 2015 through fiscal 2019, operating margins ran in the 12% to 14% range. During the post COVID demand surge of fiscal 2021 through fiscal 2023, operating margins expanded sharply, reaching 16.2% at peak in fiscal 2022, as revenue grew faster than the cost base could expand. Since fiscal 2022, operating margins have declined in each successive year: 15.1% in fiscal 2023, 14.0% in fiscal 2024, and 12.5% in fiscal 2025. The driver throughout has been SG&A.
SG&A as a percentage of revenue was 23.5% in fiscal 2022. It rose to 24.1% in fiscal 2023, to 24.9% in fiscal 2024, and to 26.6% in fiscal 2025, a consistent, multi year upward trend that predates fiscal 2025’s specific items and cannot be attributed to any single year’s activity. In absolute terms, SG&A grew $487.8 million, or 17.4%, in fiscal 2025, against revenue growth of 9.7%. The company attributed this increase to higher incentive compensation reflecting above plan performance, higher store payroll and benefits, higher corporate overhead from strategic investments, and higher store expenses.
Each of these components merits examination. Technology spending, amortisation of the Project SOAR enterprise resource planning implementation, cloud infrastructure costs, and AI personalisation systems, flows through SG&A over multiple years once the capital investment is made; it does not revert when the project is complete. Store payroll has repriced upward in a persistently tight labour market, and wage levels do not reverse when conditions ease. The Space NK acquisition, completed in July 2025, consolidated 86 stores’ worth of operating overhead into the SG&A line for the last two quarters of fiscal 2025, and that overhead is now a permanent part of the run rate. Marketing intensity has increased as the competitive environment requires greater promotional investment to maintain market share. Taken together, these are not temporary distortions around a stable underlying cost structure. They represent a cost base that has structurally repriced to a higher level, and the multi year trend in the SG&A-to-revenue ratio is the clearest evidence of that. Management has acknowledged the trajectory, CEO Kecia Steelman and the new CFO have introduced zero based budgeting and personal review of all new investment initiatives specifically to bring costs back into better alignment with revenue growth.
Net Income and Operating Cash Flow
The most important three numbers in this financial record are the ones that sit flat across the most recent three years. Net income was $1,242 million in fiscal 2022, $1,291 million in fiscal 2023, $1,201 million in fiscal 2024, and $1,154 million in fiscal 2025, lower at fiscal year end 2025 than it was three years earlier. Operating cash flow was $1,482 million in fiscal 2022, $1,476 million in fiscal 2023, $1,339 million in fiscal 2024, and $1,503 million in fiscal 2025, essentially flat over three years of revenue growth from $10.2 billion to $12.4 billion. The per share earnings growth that the EPS line shows over this period, from $24.01 to $25.64, is almost entirely the result of buybacks reducing the denominator rather than the numerator growing. The absolute earnings power of the business has not expanded since fiscal 2022.
Free Cash Flow
SBC adjusted free cash flow peaked at approximately $1.13 billion in fiscal 2022 and has since declined: $993 million in fiscal 2023, $921 million in fiscal 2024, and $1.03 billion in fiscal 2025. The fiscal 2025 figure recovered from fiscal 2024’s trough primarily through working capital timing rather than a structural improvement in earnings. FCF per share has grown modestly over this period, from approximately $22.61 in fiscal 2022 to approximately $23.74 in fiscal 2025, again driven almost entirely by the declining share count rather than FCF growth in absolute terms.
4. Capital Allocation
Ulta pays no dividend. Its capital return programme consists of share repurchases, supplemented in fiscal 2025 by the Space NK acquisition, the largest single inorganic capital commitment in the company’s recent history. This simplicity makes the allocation track record relatively easy to evaluate.
Over fiscal 2022 through fiscal 2025, Ulta repurchased approximately $3.8 billion of its own shares: $900 million in fiscal 2022, $1.01 billion in fiscal 2023, $1.02 billion in fiscal 2024, and $915 million in fiscal 2025. These repurchases reduced the diluted share count from approximately 51.7 million at the start of fiscal 2022 to approximately 45.0 million at fiscal year end 2025, a 13% reduction. As the absolute earnings base has been flat, buybacks have been the primary driver of per share metric growth over this period. Whether that represents value creation depends on whether the shares are being repurchased below their underlying worth. At 47 years of embedded cash flows, the current valuation does not make a compelling case that they are. As of fiscal year end 2025, approximately $1.8 billion remained available under the October 2024 $3.0 billion repurchase authorisation, and management has guided for approximately $1 billion in repurchases in fiscal 2026.
Capital expenditure has run at $150 million to $435 million annually across the decade, reflecting the varying intensity of store construction, remodelling, technology investment, and supply chain infrastructure. At approximately 3% to 4% of revenue, capex intensity is low relative to operating earnings, and the economics of new store construction, a net investment of approximately $2.4 million per location, with payback typically in under two years, make the expansion programme a high return use of capital. In fiscal 2025, Ulta opened 63 net new US stores and remodelled 42 existing locations.
The Space NK acquisition, at approximately $399 million net of acquired cash, placed $226 million of goodwill and $204 million of intangible assets on the balance sheet. These assets earn a return only if Space NK grows its contribution to Ulta’s brand partner relationships and, eventually, to revenue. The financial contribution from 86 stores in the UK and Ireland is currently immaterial, and the acquisition was completed partway through fiscal 2025, so its full year overhead impact will be visible for the first time in fiscal 2026. The capital was deployed at a moment when the domestic business was generating flat absolute earnings, which adds weight to the question of whether this was the highest return use of approximately $400 million.
5. Competition
The US beauty retail market represented approximately $110 to $126 billion in annual sales in fiscal 2025. Ulta holds approximately 10% of that total, with no single competitor holding a comparably defined share of the multi format, multi tier beauty destination category.
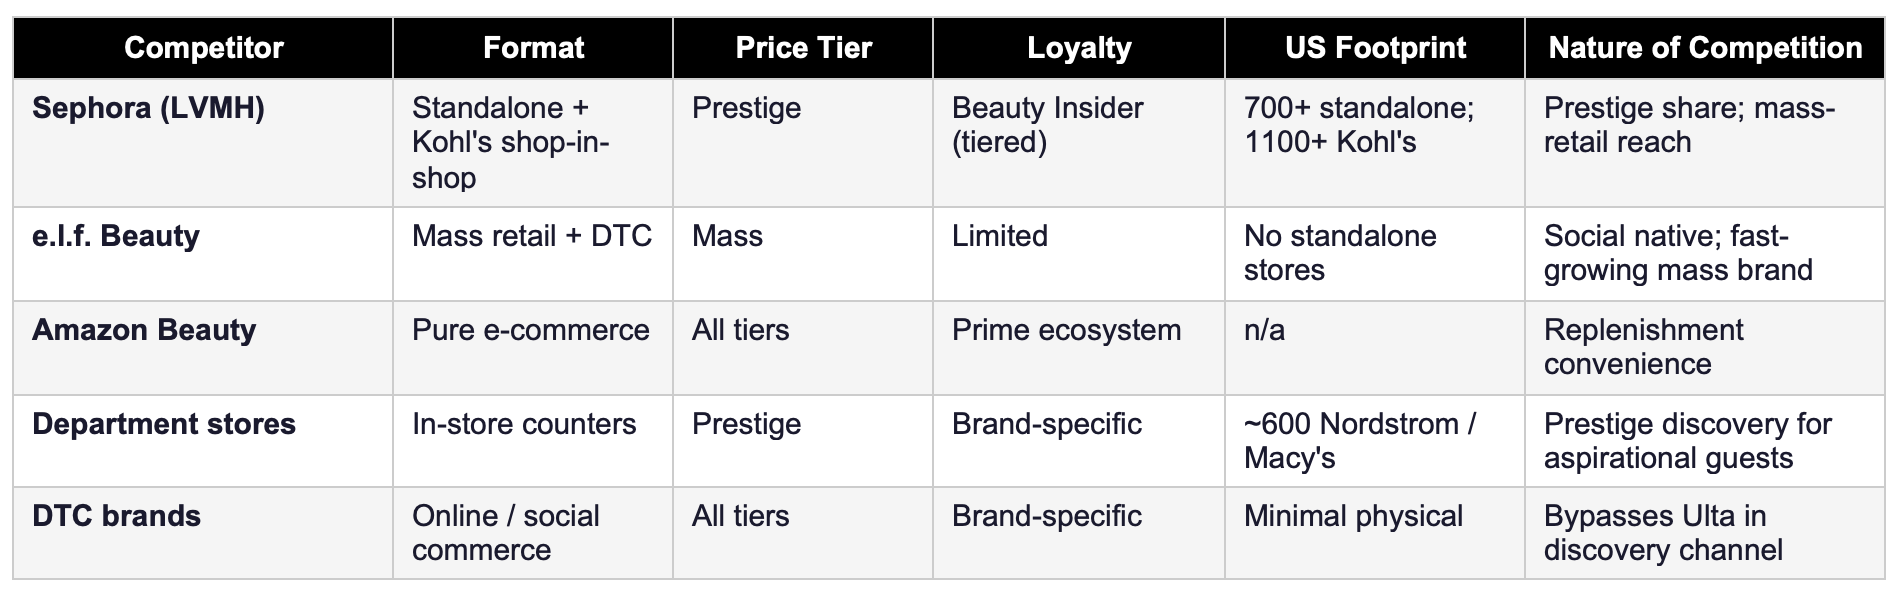
Sephora (LVMH)
Sephora is Ulta’s most direct prestige competitor and has made the most strategically significant competitive move of the past five years in embedding shop in shops at Kohl’s, a programme that has grown to more than 1100 locations and brings prestige beauty into a mass retail format at scale. The Kohl’s partnership does not offer salon services, does not carry mass products, and does not operate a loyalty programme with Ultamate Rewards’ data depth, but it improves prestige beauty accessibility for a mainstream consumer who previously might have visited Ulta for the same occasion. The competitive overlap is direct and growing.
The Ulta Beauty at Target Partnership
From 2021 through its planned conclusion in August 2026, Ulta operated a shop in shop concept inside more than 600 Target locations. On August 14, 2025, both companies announced a mutual decision not to renew the agreement. The reasons that have been reported are instructive: analysts noted that Ulta Beauty at Target locations were frequently co-located in the same strip centres as standalone Ulta stores, cannibalising the company’s own traffic. Operational reports described understaffing and a lack of specialist beauty training at Target locations, producing a guest experience materially inferior to a standalone Ulta store. The exit also reflects the declining attractiveness of the Target retail environment itself, Target’s brand reputation and store traffic have weakened materially in recent years, and Ulta’s association with a deteriorating host retailer was an incremental liability rather than an asset. For Ulta, the decision to exit refocuses growth investment on the owned store fleet and international expansion, the businesses over which it has direct operational control and which benefit fully from the loyalty programme.
Social Commerce and the Discovery Shift
The most structurally significant long term competitive challenge to Ulta’s model is the migration of beauty discovery from physical retail toward social platforms. TikTok Shop, Instagram Checkout, and the influencer to cart ecosystem are compressing the role of the physical retailer at the top of the customer journey, particularly for younger consumers who build their beauty vocabulary through content rather than store browsing. Ulta has responded with its own TikTok Shop launch, the UB Collective influencer programme, and the UB Creates content platform. But the structural reality cuts in two directions simultaneously: if social commerce drives discovery, then Ulta’s in store discovery occasion, the foundation of its loyalty data engine, faces long term pressure. And if beauty consumers begin purchasing directly through social platforms rather than through Ulta’s own channels, the advantage of Ulta’s data and the threat from online only competitors both intensify. These two outcomes are not compatible with the thesis that physical experience is structurally non replicable, and that tension is worth holding honestly.
Amazon and Replenishment
Amazon’s competitive impact on Ulta is concentrated in replenishment, the reorder of a known product at a known price, and is limited in discovery, advisory, and service occasions. The loyalty programme is Ulta’s primary defence in the replenishment channel: a member who earns and redeems points on repeat purchases at Ulta has a financial incentive to return through Ulta’s channels rather than routing orders to Amazon. The data Ulta collects on replenishment purchases also feeds the personalisation that makes the discovery relationship stronger. The defence is real, but it is not absolute, and it depends on the loyalty programme maintaining its economic value to the consumer over time.
6. Management
Ulta has had three CEOs since June 2021. Mary Dillon, who oversaw the majority of the company’s growth from 2013 to 2021, stepped down in June 2021 and was replaced by then President Dave Kimbell. Kimbell unexpectedly retired in January 2025 and was replaced by Kecia Steelman, who had served as President and COO since September 2023 and as Chief Operating Officer since June 2021. In mid 2025, CFO Paula Oyibo resigned after just over one year in the role; her replacement, Christopher DelOrefice, joined from Becton Dickinson in December 2025. At the time of this report, the CEO has been in the role for approximately 15 months and the CFO for approximately five months. The frequency of leadership change at the top of the organisation, during a period when the competitive environment is intensifying and the cost structure is requiring active intervention, is a genuine risk factor, even if corporate strategy and capital allocation policies have not materially changed through the transitions.
Steelman’s background is operational: she joined Ulta in 2015 as Chief Store Operations Officer and has spent a decade inside the business building the store operations, supply chain, and guest experience systems that underlie the competitive position. That operational foundation is relevant for a business whose moat is delivered at store level, through the salon appointment, the specialist recommendation, the loyalty programme interaction. The Ulta Beauty Unleashed strategic plan, Drive Core Business Growth, Scale New Accretive Businesses, Align Foundation for Success, is the framework under which fiscal 2025’s 5.4% comparable sales recovery was delivered. Management has guided fiscal 2026 EPS at $28.05 to $28.55, implying growth of 9.4% to 11.4% from fiscal 2025’s $25.64, with operating income growing 6% to 9% on revenue growth of 6% to 7%.
Executive compensation is predominantly variable. Base salary represents a minority of total package; the balance is split between short term incentive awards tied to annual financial targets including revenue, operating income, and FCF, and long term equity awards split between time vesting restricted stock and performance based restricted stock tied to EPS and return metrics over a three year period. The performance equity pays on a 0% to 150% scale against targets. The above plan fiscal 2025 financial performance drove materially higher incentive compensation, a direct contributor to the SG&A increase, which is the design of the programme working as intended. Whether that design produces the right long term outcomes depends on whether the targets being set are genuinely stretching relative to the business’s underlying potential.
7. Growth Levers & Addressable Market
Domestic Store Expansion
Management’s stated view is that long term US freestanding store potential exceeds 1,800 locations, implying approximately 300 additional stores from the current 1,505. At fiscal 2025’s pace of 63 net new openings annually, that runway represents roughly five years of store driven revenue contribution. At an average unit volume of approximately $8 million per store, 300 additional stores represent roughly $2.4 billion of incremental revenue, meaningful over the period, but finite. Once the store count approaches the stated ceiling, the organic growth engine for the domestic business narrows to comparable sales growth alone. If comps stabilise in the 2% to 3% range, consistent with management’s fiscal 2026 guidance of 2.5% to 3.5%, the revenue growth algorithm becomes structurally more modest, and the ability to leverage a largely fixed cost base diminishes accordingly.
Comparable Sales and Operating Leverage
Fiscal 2025’s 5.4% comparable sales growth, driven by simultaneous improvement in both transaction count and average ticket, is the most encouraging near term signal in the business. Ulta’s store cost structure contains significant fixed and semi fixed elements, meaning that comparable sales growth above a threshold level translates into operating margin expansion. Management’s fiscal 2026 guidance of 2.5% to 3.5% comparable sales growth is below fiscal 2025’s actual result. Whether that reflects deliberate conservatism or genuine uncertainty about the durability of the recovery is unclear. What is clear is that the operating leverage available from comps is most powerful precisely at the point when structural cost pressures are also at their highest, and the net effect on operating margins will be the most important financial development to monitor in fiscal 2026.
International Expansion
The international platform, Space NK in the UK and Ireland, the Grupo Axo joint venture in Mexico, and the Alshaya Group franchise in the Middle East, is the strategic optionality that Ulta did not possess three years ago. Space NK provides an established brand, a curated prestige assortment, and a route to deepen brand partner relationships in European markets. The Mexico and Middle East operations are early stage and represent Ulta’s first testing of its format and brand in emerging international markets. The strategic rationale, that global brand partners increasingly value international distribution capability in their retail relationships, is coherent. The financial contribution is currently immaterial, and the execution risk of managing multiple international markets simultaneously, while the domestic business is under cost pressure, is real. International expansion is an option that requires several years of evidence before it can be underwritten as a meaningful earnings contributor.
Retail Media and Data Monetisation
UB Media, Ulta’s retail media network, earns advertising revenue from brand partners paying for targeted placement within the Ulta digital ecosystem. With 46 million loyalty members and purchase level data covering the vast majority of transactions, Ulta’s audience targeting precision in the beauty category is superior to what horizontal platforms can offer. The economics of retail media are attractive: revenue is earned on an audience the business already owns, with advertising inventory created by existing digital traffic rather than incremental capital. The model has been demonstrated at scale by Amazon, Walmart, and Target. For Ulta, UB Media remains early stage and is not currently a material revenue contributor, but it is a genuine candidate to generate high margin incremental revenue over a five year horizon without requiring significant capital investment.
Omnichannel Deepening
The omnichannel guest, shopping both in stores and digitally, represents the highest value member profile in the loyalty programme. In fiscal 2025, active app users grew 15% year on year, with approximately 60% of online sales originating through the app. Each enhancement to the digital platform, personalised recommendations, reorder shortcuts, shade matching capabilities, is an investment in converting store only members into omnichannel members and deepening the replenishment relationship. The data supports the investment: the spending differential between omnichannel and store only guests is the clearest financial proof that the digital channel is additive rather than substitutive.
8. Valuation
Every price paid for a business contains an implicit question: how many years of future cash flows are already baked into what you are paying today? Rather than assigning a terminal value, which requires many assumptions about growth in perpetuity that no analyst can honestly support, Bearhold’s framework constructs a year by year series of discounted free cash flows and asks: at today’s stock price, how many years of future earnings are embedded? Everything the business earns beyond that point comes to you for free. The fewer the embedded years, the more of the future you receive without paying for it.
At today’s price, you are paying for everything Ulta will earn over roughly the next 47 years, in today’s money. Everything it earns beyond that comes to you for free, but that free portion begins nearly half a century from now.
Growth Engine 1: Fundamentals
The first engine is the business itself. FCF per share grows over time through revenue expansion, operating leverage, and share count reduction from buybacks. That growth, compounded annually, is what the fundamental engine delivers regardless of any valuation re-rating. Based on the recent earnings trajectory, net income flat for three years, SG&A repricing structurally higher, the domestic expansion runway approaching its ceiling, I expect FCF per share growth at or below 6% annually.
Growth Engine 2: Valuation Re-Rating
The second engine is valuation. When the embedded years are low, the market is under pricing the business relative to what it will eventually pay as confidence grows, and that re-rating produces a return on top of the fundamental growth. At 47 embedded years, the opposite is true. The market is already pricing in a growth trajectory more optimistic than what the evidence supports. A negative re-rating is possible here, which could affect the future returns from engine 1 negatively.
9. Risks
Structural SG&A Repricing
This is the most important risk in the current period, and the one with the least favourable resolution path. SG&A as a percentage of revenue has risen from 23.5% in fiscal 2022 to 26.6% in fiscal 2025, a consistent, four year upward trend. The components driving it, technology amortisation from multi year ERP and cloud investments, store payroll repriced in a persistently tight labour market, consolidated overhead from the Space NK acquisition, do not revert automatically when conditions change. They represent a permanent repricing of the cost base. Management has introduced zero based budgeting and personal executive review of new investment initiatives as corrective measures, which signals that the trend has been recognised as a problem requiring active intervention rather than a cyclical effect that will self correct. Until the SG&A-to-revenue ratio stabilises and reverses across multiple consecutive years, the structural interpretation is the more honest one.
Flat Absolute Earnings
Net income has not grown in absolute terms since fiscal 2022. Operating cash flow is essentially flat over the same period. The per share earnings growth that the EPS line presents is a function of buybacks, not business growth. A business that is returning capital to shareholders faster than it is growing its earnings base may be creating per share value in the short run, but it is also reducing the asset base available to generate future earnings.
Management Instability
Three CEOs since 2021, a CFO who resigned after 14 months, and a replacement CFO five months into his tenure at the time of this report constitute a pattern of leadership instability that coincides with the period in which the cost structure has been most in need of discipline and the competitive environment has been most demanding. Corporate strategy and capital allocation have not materially changed through the transitions, but strategic continuity at the policy level is not the same as operational and cultural continuity at the execution level. The cost discipline initiatives, zero based budgeting, executive review of investments, will take time to demonstrate results, and the leadership team executing them is relatively new.
Social Commerce and Discovery Channel Erosion
The migration of beauty discovery toward social platforms is a slow but real structural pressure on Ulta’s model. A business whose fundamental advantage is in-store discovery is exposed to any sustained shift in where consumers form beauty preferences and initiate purchase journeys. Ulta’s response, TikTok Shop launch, influencer programmes, digital personalisation investment, is appropriate, but it is also a concession that the discovery channel is evolving. If a meaningful portion of the next generation of beauty consumers builds their product relationships through social channels and purchases through brand direct or social commerce channels, the loyalty programme’s acquisition funnel weakens at its source.
International Execution Risk
The Space NK acquisition, at approximately $399 million, and the early stage Mexico and Middle East operations represent Ulta’s first significant international capital commitments. International retail is operationally demanding, regulatory requirements, consumer preferences, supplier terms, real estate markets, and talent pools all differ materially from the US. Ulta has no track record of managing international retail operations at scale. The goodwill and intangible assets from Space NK ($430 million combined) earn a return only if the acquisition delivers its strategic rationale, and the execution risk during the first several years of managing a UK business while the domestic cost structure is under pressure is real.
The Verdict
Ulta Beauty built something real over three and a half decades. The loyalty programme with 46 million active members, 95% transaction penetration, and $582 million in deferred revenue growing at 16% annually. The multi tier store format, the in-store salon services, the exclusive brand relationships, and the physical distribution network are collectively a competitive position that has outlasted 35 years of disruption attempts and has not been successfully replicated at scale by any competitor. That track record earns genuine respect and earns the business a place on the Watchlist, a recognition that the quality is real, even if the current circumstances do not support a conviction investment.
The reasons it does not earn the Approved designation at this time are specific and data driven. Net income has not grown in absolute terms since fiscal 2022. Operating cash flow has been essentially flat over three years of revenue growth from $10.2 billion to $12.4 billion. SG&A as a percentage of revenue has risen in each of the past four years and is now structurally higher than the pre surge period, reflecting a cost base that has permanently repriced through technology investment cycles, labour market repricing, and the Space NK acquisition overhead. The domestic growth runway is finite, approximately 300 additional stores, and beyond it the business is dependent on comparable sales growth at a rate that management’s own guidance suggests will be modest. International expansion is early stage and unproven at scale. The leadership team has not been stable.
What Would Change My Mind
A significant improvement in the valuation, combined with demonstrated stability in the management team across at least two full annual reporting cycles, and evidence that international markets are becoming a meaningful and measurable earnings contributor, are the three conditions that would warrant upgrading Ulta from Watchlist to Approved and considering initiation. I would also want to see the SG&A-to-revenue ratio declining across at least two consecutive fiscal years before accepting that the structural repricing has been addressed. Until those conditions are met, the business sits on the Watchlist, acknowledged as a genuine franchise with a durable loyalty moat, but not one where the current evidence supports a conviction position.
This report reflects the author’s personal views and is not an investment advice. Investing carries the risk of permanent capital loss. Read the full disclaimer here