

Under The Hood, Pool Corporation - $POOL
Company Analysis & Valuation


THE OUTLOOK
There are approximately 6.1 million in-ground swimming pools in the United States. Each one needs chemicals, replacement parts, and regular maintenance throughout its lifetime, regardless of what interest rates are doing, regardless of whether anyone is building new pools, regardless of the broader economy. The market for maintaining these pools does not disappear in a downturn. It grows, steadily, as the installed base expands year after year.
Pool Corporation (POOL) sits at the wholesale distribution layer between the manufacturers who make pool products and the 125,000 contractors, service companies, and retailers who sell those products to end consumers. It is the largest business of its kind in the world, with 456 sales centres, approximately 40% of the US wholesale distribution market, and a flywheel of scale that has been compounding for over four decades.
The business is currently earning below its normalised level. New pool construction fell to just below 60,000 units in 2025, roughly half of pandemic-era peak volumes. Elevated financing costs have suppressed homeowner discretionary spending on pools, renovations, and upgrades for three consecutive years. The result is a peak-to-trough earnings-per-share (EPS) compression from $18.70 in 2022 to $10.85 in 2025.
The maintenance revenue base, which represents approximately 64% of Pool’s sales and comes from the inelastic, recurring demand of existing pool owners, held steady throughout this period and grew modestly as the installed base expanded. The competitive position did not weaken. Gross margins held within a few basis points of their historical range. Return on invested capital (ROIC) declined from its peak but remained above 16%, above the cost of capital, in a trough year for the industry. No meaningful market share was lost to competitors.
Pool Corporation is Approved in the Bearhold Universe. The business has demonstrated over four decades that its scale advantages compound, its competitive position strengthens through cycles, and its maintenance revenue base is structurally permanent.
My valuation puts Pool at approximately 15 years of embedded discounted cash flows at current prices. I hold a position initiated before publication of this report. This report explains the business, the thesis, and where the risks sit.
Disclosure: The author holds a position in POOL. This report reflects the author’s personal views and is not an investment advice. Investing carries the risk of permanent capital loss. Read the full disclaimer here
At a Glance
Company: Pool Corporation
Ticker: $POOL · NASDAQ
Sector: Industrials
Industry: Wholesale Distribution
Market Cap: $8.3 billion (at $225)
Status: Approved
First Coverage: April 2026
Valuation Zone: Attractive (last updated in April 2026)
1. The Business
The Origin
Pool Corporation traces its roots to 1980, when Frank St. Romain, a former warehouse manager, and his partner Richard Smith founded South Central Pool Supply in New Orleans. The founding insight was simple and durable: insurance companies and pool professionals needed a professional, geographically distributed source for pool supplies and equipment. The fragmented local dealers serving that need were doing it poorly.
For its first decade, South Central Pool Supply grew modestly, building a reputation for service and expanding steadily across the Southeast and into Oklahoma, Texas, and Tennessee. Growth was constrained by access to capital, as then-president Manuel Perez de la Mesa later described it, the company funded expansion almost entirely from retained earnings. By 1993, annual revenues had reached approximately $67 million.
The inflection came in 1993, when private equity firm Code Hennessey & Simmons acquired the company in a leveraged buyout (LBO), incorporated it in Delaware as SCP Holding Corp, and set out to use South Central Pool Supply as a platform for aggressive national consolidation. The strategy was straightforward: the US pool distribution market was deeply fragmented, and a well-capitalised consolidator with the right model could roll it up. Wilson B. ‘Rusty’ Sexton became Chairman and Chief Executive Officer (CEO).
In 1995, the company renamed itself SCP Pool Corporation and went public on the NASDAQ stock exchange under the ticker POOL, raising capital that retired its debt and funded further expansion. The initial public offering (IPO) proceeds unleashed the acquisition campaign: within five years, SCP had acquired dozens of regional distributors and opened scores of new sales centres. Annual revenues grew from $102 million in 1994 to $670 million by 2000.
A pivotal expansion came in August 2000, when SCP acquired Superior Pool Products from Arch Chemicals, at the time a 19-location distributor operating primarily in California, Arizona, and Nevada with revenues exceeding $80 million. Rather than absorbing Superior into the SCP network, management made the strategic decision to operate two distinct domestic distribution networks side by side, each with its own product selection, sales personnel, and supplier relationships. The logic was deliberate competition between internal networks to drive service quality, an unusual approach that has proven effective.
Manuel Perez de la Mesa, who joined as Chief Operating Officer (COO), became President and CEO in 2001 and led the company for nearly two decades. Under his leadership, Pool expanded internationally, launched the Horizon Distributors irrigation business, and broadened the product offering far beyond pool chemicals into building materials, outdoor living, and commercial pool products. At the end of 2018, Peter D. Arvan succeeded him as CEO, bringing over 20 years of distribution industry experience. On May 16, 2006, SCP Pool Corporation became Pool Corporation, a single name for what had become the world’s dominant force in pool wholesale distribution.
What Pool Corporation Does
Pool Corporation does not build pools. It does not install them, service them, or repair them. It is the wholesale distribution layer, the intermediary that sits between manufacturers and the fragmented network of pool professionals who serve end consumers.
When a pool builder needs concrete, pumps, filters, tiles, and chemicals for a new installation, they order from Pool. When a service technician needs a replacement part for a malfunctioning heater, they call Pool. When a specialty retailer needs to restock their shelves with chemicals and accessories, they order from Pool. Pool takes possession of product from over 2,200 manufacturers, holds inventory across 456 geographically distributed sales centres, and delivers to contractors and retailers, often the same day. It earns a margin on every product it passes through the supply chain.
This hub-and-spoke model is the foundation of the business. Pool does not compete nationally in any meaningful sense, it competes market by market. Each sales centre is positioned within a population centre, close to contractor customers, with well-stocked inventory and local delivery capability. A pool professional in suburban Houston does not care about national market share; they care whether their local Pool centre can get them what they need, today, at a competitive price. Pool’s network is built to answer yes to that question in virtually every significant pool market in North America.
The Five Networks
Pool Corporation operates through five wholly-owned subsidiary distribution networks, each serving a distinct segment of the market. Understanding these networks matters because they are not divisions of the same business in a superficial sense, they have different brand identities, different product selections, and in some cases, different types of customers. Pool maintains them separately by design.
SCP Distributors (SCP) is the original network, descended from South Central Pool Supply. It is the largest of the five, operating 224 sales centres domestically and 48 internationally as of year end 2025. SCP handles the full range of swimming pool supplies, equipment, and related leisure products for the domestic market and serves as Pool’s primary international distribution platform.
Superior Pool Products (Superior) is the second domestic swimming pool network, acquired in 2000 and deliberately maintained as a separate operation. Superior operates 75 centres, primarily serving pool builders, service companies, and retailers with a different product mix and distinct supplier relationships from SCP. The rationale for two separate domestic pool networks is intentional competitive tension: SCP and Superior compete in many markets, which management believes drives better service quality than a single monopoly distributor would provide. This may seem counterintuitive, why compete with yourself? but the track record suggests it works.
Horizon Distributors (Horizon) is Pool’s irrigation and landscape maintenance subsidiary, operating 88 sales centres focused on irrigation system components, professional turf care equipment, hardscapes, and landscape maintenance supplies. Horizon serves landscape contractors and commercial operators rather than pool professionals. The business shares many characteristics with the pool distribution model, fragmented customers, recurring demand, local delivery, and benefits from Pool’s purchasing scale and supplier relationships.
National Pool Trends (NPT), formerly known as National Pool Tile until a rebrand in November 2025, is a specialised network focused on swimming pool tile, composite pool finishes, decking materials, and interior pool surfacing products. NPT operates 19 standalone sales centres, but its reach is substantially broader: 124 SCP and Superior locations also feature NPT consumer showrooms where contractors and homeowners can view and select tile, decking, and surfacing options. NPT’s products are more discretionary in nature than chemicals or replacement parts, making this segment more sensitive to the construction and renovation cycle.
Sun Wholesale Supply is the most recently added network, acquired as part of Pool’s December 2021 purchase of Porpoise Pool & Patio. Sun Wholesale’s primary role is servicing the Pinch A Penny franchise network, a chain of independently owned specialty retail pool stores, the largest pool franchise system in the United States. Sun Wholesale supplies these franchisees with pool chemicals, equipment, and accessories, and owns a chemical re-packaging plant in Florida that produces proprietary branded products sold through the Pinch A Penny system. The Pinch A Penny network grew to over 300 franchise locations by year-end 2025, adding 10 new stores during the year and expanding into two new states.
The Revenue Mix
In 2025, approximately 64% of Pool’s sales came from recurring maintenance and minor repair of existing pool installations. These are the chemicals, replacement parts, and minor consumables that pool owners must purchase to keep their pools functional and safe, the non-discretionary foundation of the business. Approximately 22% came from remodeling, renovation, and upgrades, and the remaining 14% from new pool construction. This structure matters because the 64% non-discretionary base does not compress in downturns. It grows every year with the installed base, providing the revenue floor that sustains the business through every economic cycle.
Scale and Geography
Pool’s 456 sales centres at year-end 2025 are disproportionately concentrated in the markets with the greatest pool density. California, Florida, Texas, and Arizona together account for approximately 53% of annual net sales. Pool operates 77 locations in California, 67 in Florida, 55 in Texas. These are also the states receiving the largest net domestic migration inflows. The demographic tailwind of population movement toward warmer climates creates pool installation demand and maintenance volume growth that flows directly to Pool’s most dense network regions.
Internationally, Pool operates in Europe, primarily through the UK, France, Spain, Germany, Belgium, Croatia, Italy, and Portugal, and in Australia. International operations represented approximately 5% of net sales in 2025, growing 5% in local currency terms. Europe is structurally earlier in its pool distribution evolution than the US, representing a long-runway optionality rather than a near-term growth driver.
2. The Moat
Pool’s competitive advantage is scale economies shared, one of the most durable forms of moat in distribution because it is self-reinforcing and strengthens with each passing year.
How the Flywheel Works
Pool’s scale allows it to purchase from 2,200 suppliers at better prices than any regional distributor can negotiate. It passes a portion of those better economics to contractor customers as better pricing, better product availability, and faster delivery. Contractors consolidate purchasing with Pool. Pool’s volumes grow. Purchasing leverage increases. Smaller competitors are squeezed on margins and cannot match Pool’s service levels. They lose customers or exit. Pool absorbs their volume. Repeat.
This flywheel has been running for over 40 years. Revenue per sales centre has grown at nearly 6% per year since 2014, outpacing the approximately 3% annual growth in centre count over the same period. Each location is becoming more productive, not just the network expanding. That is the flywheel operating.
Four Pillars
The first pillar is purchasing leverage from scale. Pool’s volumes across 2,200 suppliers give it negotiating power that no regional competitor can match. Its preferred vendor programme concentrates purchasing to extract better terms, rebates, early-buy discounts, priority allocation, which flow into gross margin stability even as the revenue mix shifts through cycles.
The second pillar is product breadth. Pool offers over 200,000 products across more than 700 product lines and 40 product categories. A contractor purchasing from a smaller regional distributor faces a fundamentally inferior selection. In a service business where time is money, the convenience of a single trusted source with comprehensive inventory is worth more than marginal savings on individual items. No competitor can replicate this breadth without decades of supplier relationship building and the capital to finance the inventory position.
The third pillar is local delivery infrastructure. Pool’s sales centres sit within population centres near customer concentrations. The ability to deliver same-day or next-day to contractors in their local market is operationally critical. A pool professional who needs a pump motor today cannot wait for an online order. This geographic density is a physical infrastructure moat, expensive to build, slow to replicate, and self-reinforcing as Pool adds 8 to 12 new centres per year.
The fourth pillar is POOL360 digital integration. POOL360 is Pool’s proprietary business-to-business (B2B) digital platform, which includes e-commerce ordering, water testing software (POOL360 WaterTest), and a field service management application (POOL360 PoolService) that allows pool professionals to manage their scheduling, routing, billing, and customer relationships from a single mobile application. A contractor who has embedded POOL360 into their daily workflow is not switching distributors to save 2% on one product category. POOL360 reached an all-time high of 15% of total sales in FY2025, up from 10% in 2023. The trend has been consistently upward for four consecutive years, which is the most important forward-looking signal in the moat analysis.
Financial Evidence
Gross margins averaged approximately 29% to 30% across every year of the past decade, including the trough years of 2023 through 2025. A business losing its competitive position would see gross margins compress as it discounts to retain volume. Pool’s gross margins have not compressed.
ROIC averaged above 20% over the decade, and in 2025, with earnings per share (EPS) having fallen from a peak of $18.70 in 2022 to $10.85, ROIC still sits at approximately 16%. For a wholesale distribution business with no proprietary physical products, sustaining returns above the cost of capital through a decline of that magnitude is a meaningful signal that the structural economics of the business are intact. The capital invested in the network is generating returns. No meaningful market share has been lost to competitors in this period.
The supplier concentration itself confirms market power. Pool’s top three suppliers, Pentair, Zodiac, and Hayward, collectively account for approximately 43% of Pool’s cost of goods sold (COGS). These are large, sophisticated manufacturers who sell through Pool because Pool is the most efficient route to the fragmented contractor market. They depend on Pool. That dependency is evidence of distribution leverage, not exposure.
3. Financial Performance
The financial record of Pool Corporation over the past ten years tells two stories simultaneously. The first is structural: a business with genuine competitive advantages compounding revenue, earnings, and free cash flow at exceptional rates over the long arc. The second is cyclical: a business whose earnings expanded dramatically during an extraordinary pandemic-era demand surge and have since normalised back toward their historical range. Reading the numbers correctly requires keeping both stories in view.
Revenue
Revenue grew from $2.36 billion in 2015 to a peak of $6.18 billion in 2022, a compound annual growth rate (CAGR) of approximately 15% over seven years. Since 2022, revenue has declined to $5.29 billion in 2025, entirely reflecting the reduction in new pool construction and renovation activity. The maintenance revenue base did not contract. The compression is entirely in the discretionary segment.
The Pandemic Surge and the Normalisation
Understanding the operating margin trajectory requires understanding what happened during 2020 through 2022. For the decade prior to the pandemic, Pool’s operating margin averaged approximately 10%, a stable, predictable range that reflected the economics of a distribution business with consistent gross margins and a fixed cost structure.
The COVID-19 pandemic created an extraordinary and temporary departure from that baseline. As families spent more time at home and sought to create or expand outdoor living spaces, demand for new pool construction surged dramatically. Combined with homeowners who were already invested in their properties, supported by rising home values, low mortgage rates, and a perception that their homes had become their primary entertainment and recreation venues, Pool’s revenue grew from $3.9 billion in 2020 to $6.2 billion in 2022. Operating leverage on a fixed cost base that could not scale as fast as revenue drove operating margins to 15.7% in 2021 and 16.6% in 2022, levels that had never been seen in the company’s history.
Since the second half of 2022, this surge has reversed. Elevated interest rates have suppressed new pool construction. Consumer discretionary spending has moderated from pandemic highs. Revenue has declined from its peak, and operating margins have returned to approximately 11% in 2025, essentially the pre-pandemic normal. This is not deterioration. The operating margin has returned to its historical range, not fallen below it. The 2021 and 2022 margins were the anomaly.
Earnings Per Share
Diluted EPS grew from $2.90 in 2015 to $18.70 at the 2022 peak, a 7-year CAGR of approximately 30%. From the peak, EPS has declined to $10.85 in 2025, reflecting the revenue normalisation described above. Neither number represents the mid-cycle earning power of the business. The $18.70 incorporated extraordinary pandemic demand; the $10.85 reflects a construction market at approximately half of normalised levels. The normalised earning power sits somewhere in between, and the Valuation section addresses this directly.
The share count has declined from approximately 44.3 million diluted shares in 2015 to 37.3 million in 2025, a reduction of approximately 16% through consistent buyback programmes. In 2025 alone, Pool repurchased $341 million of its own shares. That discipline compounds EPS growth on top of the underlying business performance.
Gross Margin
Gross margin has held in a narrow band of 28.6% to 31.3% across the full decade. The 2025 gross margin of 29.7% is essentially identical to 2024. Adjusting for the one-off $12.6 million import tax reversal that benefited 2024’s gross margin, the underlying 2025 gross margin actually improved 20 basis points year over year, reflecting Pool’s pricing discipline and supply chain management even in a softer demand environment.
Free Cash Flow and the OCF Story
Operating cash flow (OCF) was $888 million in 2023, $659 million in 2024, and $366 million in 2025. The decline from 2024 to 2025 appears dramatic but is substantially explained by working capital timing rather than a deterioration in the underlying business.
Three components of working capital combined to suppress OCF in 2025. First, inventory increased by $165 million during the year. Management explicitly attributed this to strategic purchasing ahead of anticipated vendor price increases, a deliberate decision to build stock before tariff-related and inflation-driven cost increases took effect. Second, accounts receivable increased by approximately $33 million, primarily driven by higher sales in December 2025, which fell outside the collection window for year-end cash. Third, accounts payable declined by approximately $44 million as Pool paid down supplier balances at a faster rate relative to the elevated payable levels of 2024, when the company had benefited from extended seasonal payment terms. These three working capital movements together subtracted approximately $150 million from operating cash flow. The fourth and largest factor was a $68.5 million federal income tax payment in 2025 that had been deferred from 2024, a one-time cash outflow with no impact on the underlying profitability of the business.
Adjusting for the deferred tax payment alone, 2025 OCF would have been approximately $434 million, or 107% of net income, consistent with Pool’s historical cash conversion rate. Free cash flow of $310 million therefore understates run-rate cash generation. The 2024 OCF of $659 million, with normal working capital dynamics, is the more reliable anchor for what the business can produce at stable conditions.
Inventory Days: A Decade-High That Deserves Scrutiny
Days inventory outstanding (DIO), the number of days Pool holds inventory before it is sold, has climbed steadily from approximately 96 days in 2020 to 135 days in 2025, the highest level in a decade. This is worth examining carefully because elevated inventory days affect multiple financial metrics simultaneously: they tie up working capital, reduce free cash flow, and, if the inventory cannot be sold at full margin, compress profitability.
The 2025 inventory build reflects a deliberate strategic decision by management. Pool purchased ahead of anticipated price increases, both from inflation running at approximately 2% to 3% in 2025 and from tariff impacts that management expected to flow through the supply chain. Pool explicitly disclosed this in the Q4 2025 earnings presentation, noting that inventory growth reflected inflation, strategic pre-buy purchasing, acquisitions, and new sales centre additions.
The bull case for this strategy is straightforward: if vendor prices rise as expected, Pool’s early-bought inventory sits on the balance sheet at below-market cost, and when sold, generates better margins than inventory purchased at higher post-increase prices. Pool has a long history of making similar strategic inventory decisions during inflationary periods, the company’s preferred vendor programme and early-buy arrangements with manufacturers are specifically designed for this kind of counter-cyclical purchasing.
The risk case is equally clear. If the price increases management anticipated do not materialise, if tariff impacts are reversed, if inflation moderates, or if demand remains soft and inventory sits longer than planned, then Pool is holding a larger stock of product than it needs, at cost prices that may be above what it can charge in a deflationary environment. The company acknowledges this explicitly in its risk factors: overestimating demand and purchasing too much of a particular product creates the risk that prices fall, leaving inventory that cannot be sold at optimal margins or, in a worst case, requires a write-down.
The chemical and maintenance portion of Pool’s inventory, approximately 14% of net sales comes from pool and hot tub chemicals, adds a specific wrinkle. Pool chemicals such as chlorine products, algaecides, and pH adjusters have finite shelf lives. While Pool manages this risk through its reserve for inventory obsolescence (currently $23.9 million), elevated holding periods increase exposure to degradation, regulatory change, and shifts in consumer preferences for specific chemical formulations. Equipment and building materials carry lower obsolescence risk but are more sensitive to technology cycles and construction activity levels.
To contextualise the scale: the 2023 DIO of approximately 139 days was the decade peak, coinciding with the period when Pool was drawing down the inventory it had aggressively built during the pandemic surge. The 2025 level of 135 days is approaching that level again from a different direction, a deliberate build rather than a demand-driven drawdown. The distinction matters, but the risk of being wrong is real and I carry it explicitly.
Balance Sheet and Equity Trajectory
Pool’s balance sheet has undergone a meaningful structural shift over the past several years that is worth examining carefully.
Total equity grew consistently from $256 million in 2015 through $1.31 billion in 2023, an expansion driven by profitable growth, modest leverage, and retained earnings accumulating on the balance sheet. From 2023 onward, equity has declined, from $1.31 billion to $1.27 billion in 2024 and $1.19 billion in 2025. This reversal is not a sign of financial distress, but it does reflect a clear and deliberate capital allocation choice.
The primary driver is the share buyback programme. Pool repurchased $306 million of shares in both 2023 and 2024, and $341 million in 2025, the largest annual repurchase in company history. These buybacks are funded partly from operating cash flow and partly from incremental borrowing, which is why total debt increased by $249 million in 2025. When a company borrows to buy back its own shares, equity shrinks, buyback proceeds reduce equity directly, while the debt that funded them sits on the liability side of the balance sheet.
Retained earnings tell the same story. Retained earnings peaked at approximately $700 million in 2023 and declined to $521 million in 2025, as the combination of buybacks and dividends paid out more than the net income being retained. Pool paid $185 million in dividends in 2025, marking the 21st consecutive annual dividend increase.
The debt-to-equity (D/E) ratio has risen from 1.00x at year-end 2024 to 1.30x at year-end 2025. This remains within management’s stated target leverage range of 1.5x to 2.0x on a debt/EBITDA basis (Pool’s preferred internal leverage metric). For context, the D/E ratio reached 2.98x in 2018 at a prior leverage peak, and the business remained healthy throughout. The current level is moderate and well within the boundaries of Pool’s financing capacity.
The question this raises for a long-term investor is whether aggressive buybacks at current prices represent good capital allocation. At $225 and approximately 15 years of embedded cash flows, buying back shares at attractive prices is a reasonable use of capital. Management has consistently demonstrated that they would rather deploy capital to buybacks than hold excess cash, and the per-share compounding effect of a declining share count is real regardless of entry price.
4. Competition
A Fragmented Market with One Dominant Player
The competitive structure of US pool wholesale distribution is unlike most industries. At national scale, Pool Corporation is effectively the only fully-formed competitor. The remaining approximately 60% of the US market is distributed among regional and local distributors who lack Pool’s purchasing leverage, product breadth, and logistics infrastructure. This is not a duopoly or a tight oligopoly, it is one dominant national platform and several hundred smaller regional players.
Pool holds approximately 40% of the US wholesale pool distribution market. Management’s 2025 annual report notes that the company believes its selection of pool products is the most comprehensive in the industry, with more than 700 product lines across approximately 40 product categories. That breadth, combined with geographic density that allows same-day delivery in virtually every major pool market, is a service proposition that smaller distributors simply cannot replicate at comparable cost.
The competitive gap has widened over time. While specific current data on competitor facility counts versus Pool’s is not available from the 2025 annual report, the long-term trajectory is clear from the financial record: Pool has been consistently gaining share through network expansion at a pace that smaller competitors cannot match, and the structural advantages of scale, purchasing leverage, product breadth, POOL360 digital integration, compound each year.
The Amazon Question
The e-commerce and direct distribution question is the one I hold with genuine uncertainty over a long horizon. Amazon already sells pool chemicals and basic equipment directly to consumers and some contractors. The question is whether direct-from-manufacturer or Amazon purchasing becomes cost-effective enough for contractor workflows to displace Pool as the primary source.
Pool’s defence has three components, and the evidence on each is currently favourable. Same-day local delivery is an advantage that Amazon cannot replicate without the same physical infrastructure investment Pool has made over four decades. Product breadth of 200,000 SKUs means a contractor relationship involves hundreds of different items across dozens of categories, the convenience premium of a single trusted source is real. And POOL360 integration at 15% of total sales and rising means Pool is building its own digital capability before the competitive challenge fully develops.
None of this permanently closes the question. It means the defence is well-constructed, the early evidence is encouraging, and the competitive outcome over the next decade looks meaningfully better than the disruption narrative implies. I monitor it rather than dismiss it.
The Leslie’s Contrast
Leslie’s (LESL), the publicly traded specialty pool supply retailer, is sometimes cited as a peer. It is not a direct competitor. Leslie’s is a consumer-facing retail operation, not a wholesale distributor, and its financial trajectory has been one of significant distress in recent years, with deep losses and balance sheet stress. The contrast with Pool’s wholesale distribution model is instructive: serving professional contractors with a more defensible service proposition, at higher volumes, with better economics, is structurally superior to consumer retail in this industry.
5. Management
Update - May 2026: Peter Arvan stepped down as President, CEO and board member on May 4, 2026, in what the company described as a mutual agreement with no disagreement over operations or policies. John B. Watwood, who joined Pool as Executive Vice President in January 2026, was appointed as his successor the same day. Watwood brings over two decades of industrial and specialty distribution experience. Given his four-month tenure at Pool at the time of appointment, there is insufficient operational track record to assess his fit for the role. The investment thesis is unchanged, the moat, the installed base, and the construction recovery thesis are independent of management continuity.
Peter Arvan became President and CEO of Pool Corporation at the end of 2018, succeeding Manuel Perez de la Mesa, who had led the company for nearly two decades. Arvan brought over 20 years of distribution industry experience to the role, which matters more here than it would in most industries. Pool’s business model is operationally intensive, managing 456 sales centres, 2,200 supplier relationships, a 200,000-SKU inventory position, and a contractor customer base that values service consistency above all else. A CEO who understands distribution economics at the operational level is better equipped to manage this complexity than a generalist executive would be.
The tenure since 2019 coincides with a period of significant operational challenge: the pandemic demand surge, the subsequent normalisation, three years of construction suppression, and a deliberate technology platform build-out in POOL360. Through this cycle, the structural economics of the business have remained intact, gross margins held, ROIC stayed above the cost of capital at the trough, and market share was not lost. That is not a given outcome; it reflects operational execution.
Arvan holds approximately 86,400 shares, worth roughly $19 million at current prices. That represents approximately 0.23% of shares outstanding, a meaningful personal position for an individual, though not large enough to constitute a controlling interest or to align management and shareholder incentives in the way founder ownership does. It is the kind of holding that keeps a CEO focused on share price over a five-year horizon; it is not the kind that makes him a co-owner in spirit.
In December 2025, Arvan sold a portion of his holdings (approximately 11,000 shares) in a single transaction. I note this honestly rather than dismissing it. A single sale during a period when the stock was trading below its 52-week high, by a CEO who still holds $19 million in company shares, does not strike me as a meaningful negative signal. But it is a data point worth tracking. A pattern of consistent net selling would change my view; one transaction does not.
On the board, Manuel Perez de la Mesa, Arvan’s predecessor as CEO and the architect of Pool’s modern business model, remains a director and holds approximately 97,500 shares. His continued involvement at board level and his personal economic stake in the business is a meaningful signal: the person who built the flywheel believes in its continued value. Total insider ownership across all directors and officers stands at approximately 388,000 shares, or 1.04% of shares outstanding. This is not a founder-led business in terms of insider concentration, but neither is it a company where management has no economic skin in the outcome.
Compensation Structure
Arvan’s total compensation for FY2025 was approximately $5.3 million, below the median of the peer group Pool uses for benchmarking. Base salary is $900,000, roughly 17% of total compensation, meaning 83% of pay is variable and tied to performance outcomes. I consider this an appropriate structure. A CEO whose pay is predominantly fixed has limited downside exposure to poor decisions; a CEO whose pay is predominantly variable is aligned with shareholders in a meaningful way.
The long-term equity component, the largest slice of total pay, is split equally between time-based restricted stock (three-year cliff vesting) and performance-based restricted stock tied to diluted EPS targets. The performance awards pay out on a 0% to 150% scale depending on whether EPS targets are met, providing upside for outperformance and meaningful forfeiture risk if results disappoint. EPS as the performance metric is well-chosen for Pool: it captures the combined effect of earnings growth and the share buyback programme, both of which are within management’s control and directly relevant to shareholder value creation. The overall compensation structure is judged appropriate.
6. Growth Levers & Addressable Market
Four Structural Drivers
Construction Recovery
New pool installations fell from pandemic peaks of over 100,000 units annually to just below 60,000 units in 2025. The suppression is entirely financial: pools are primarily financed through home equity borrowing, and when mortgage rates rose sharply from 2022 onwards, homeowners deferred the decision. This is not a permanent structural decline in demand for pools, it is a rate-driven deferral.
The important nuance is that management’s 2026 guidance explicitly assumes new construction units consistent with 2025. Pool is not projecting a recovery; they are projecting another trough year. That conservatism is appropriate given current rate levels, but it also means the construction recovery is not priced into the business at current earnings levels. When rates normalise and construction recovers toward the historical average of 80,000 to 85,000 units annually, Pool captures that revenue incrementally, on top of a maintenance base that is growing regardless.
Each new pool is also not a one-time event for Pool. It joins the installed base permanently and begins generating recurring annual maintenance demand for 20 to 30 years. A recovery in construction from 60,000 to 80,000 units adds not just current-year construction revenue but a compounding permanent addition to the non-discretionary revenue base.
The Technology Upgrade Cycle
The installed base of US pools is ageing. Pools installed in the 1990s and early 2000s are now 25 to 35 years old and require equipment replacement. The technology gap between old and new equipment is substantial. Variable speed pumps use 75% to 80% less electricity than single-speed equivalents. LED pool lighting uses 70% less energy than incandescent. Automated pool controls, allowing smartphone management of pump schedules, heating, lighting, and chemical dosing, are now standard on new installations and desired retrofits on older ones.
California mandated variable speed pumps statewide from 2025. Pool operates 77 locations in California, making it the single largest state in Pool’s network. Other states historically follow California’s energy efficiency leadership with a multi-year lag. This mandate creates a legally-enforced replacement cycle across Pool’s largest market, with similar mandates likely spreading. The upgrade cycle is broad-based, multi-year, and structural, it does not depend on consumer confidence, interest rates, or new construction activity.
Sunbelt Demographics
Florida, Texas, California, and Arizona account for approximately 53% of Pool’s net sales. These are also the states receiving the largest net domestic migration inflows. Pool’s network concentration in these markets is not accidental, it is the result of decades of market-by-market expansion following population density. The ongoing migration toward warmer climates creates pool installation demand and maintenance volume growth that accrues directly to Pool’s most concentrated network regions without requiring any strategic repositioning.
Fragmented Market Consolidation
Pool adds 8 to 12 new sales centres annually. Each new centre is positioned to serve a local market more effectively than smaller competitors, absorbing volume through better service and pricing. In 2025, Pool added 8 new greenfield centres and acquired 3, for a net addition of 8 after 3 closures. At this pace, Pool’s structural lead over regional competitors widens year after year, and the flywheel described in the Moat section turns one more cycle.
Adjacent Opportunity
Pool’s expansion into irrigation, landscape maintenance, hardscapes, and outdoor living products through Horizon and NPT is early-stage. I treat it as optionality rather than a core driver. The Horizon 24/7 B2B platform and the NPT consumer showroom network are genuine value additions, but they do not yet move the needle on overall earnings in a material way. The potential is there; the execution record in these adjacencies is still developing.
7. valuation
What Today’s Price Assumes
My valuation framework expresses intrinsic value as years of embedded discounted cash flows. Rather than using a terminal value, which requires assumptions about perpetuity growth rates I find too speculative to be reliable. I model an explicit series of annual free cash flows per share, discount each one back to the present at an appropriate rate, and ask: how many years of future cash flows does today’s price already contain?
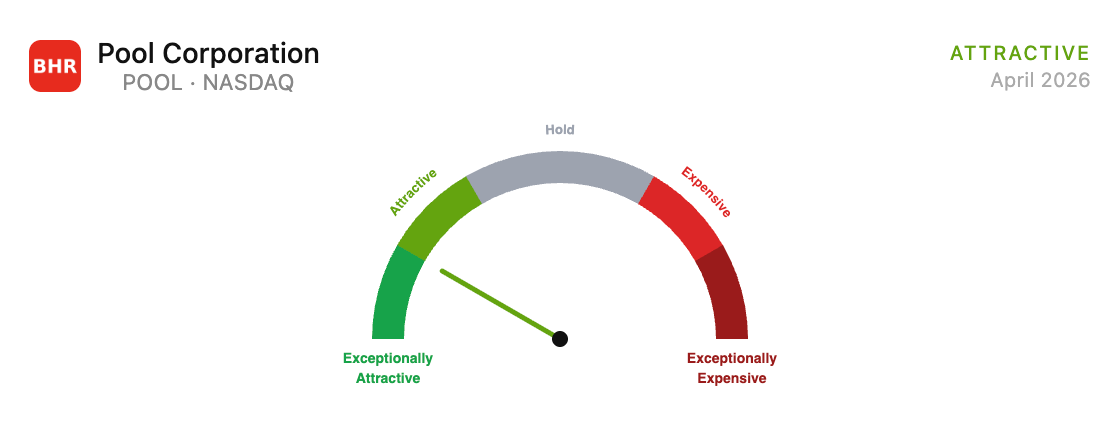
The framework has five zones. Exceptionally Attractive sits below 15 years. Attractive runs from 15 to 20 years. Hold covers 20 to 30 years. Expensive runs from 30 to 35 years. Exceptionally Expensive is anything above 35 years. I initiate new positions only in the Attractive or Exceptionally Attractive zones
The single most important decision in valuing Pool is choosing the right starting point for free cash flow (FCF) per share. Current FCF of approximately $8 to $9 per share is not the right number, it reflects a construction environment at roughly half of normalised levels, working capital timing distortions from the 2025 inventory build, and the deferred tax payment described in the financial section. Using current FCF as the base would be like pricing a hotel chain on occupancy rates during a recession.
The framework I apply here is the same used in prior Bearhold reports where current FCF understates normalised earning power: I use a normalised FCF per share estimate with an explicit explanation of why current figures are distorted. My base case is $15 per share, representing mid-cycle conditions, construction volumes recovering to approximately 80,000 to 85,000 units annually, normal renovation activity, maintenance base growth continuing at approximately 1% to 2% per year, and stock-based compensation (SBC) deducted from operating cash flow as a real economic cost to shareholders. The upper end of my range is approximately $17 per share, anchoring to 2024 OCF of $659 million as a more representative year for underlying cash generation capability.
I present the range rather than a single number because the honest answer is that normalised FCF has genuine uncertainty. If mid-cycle earning power settles at $13 rather than $15, because cost inflation proves stickier, or because the construction recovery is shallower than expected, the valuation picture is less attractive. I carry that uncertainty explicitly.
The Result
At approximately $225, my model puts Pool at around 15 years of embedded discounted cash flows, the lower boundary of the Attractive zone, approaching Exceptionally Attractive territory. I hold a position initiated before this report’s publication.

The 2026 guidance from Pool’s management, projecting EPS of $10.85 to $11.15 with no construction recovery assumed, confirms that the market is pricing the business at close to trough earnings. That is a different and more interesting situation than being priced at trough earnings with a trough valuation multiple. At 15 years in the Attractive zone, Pool’s current valuation is attractive, especially considering we are at a cyclical low point for earnings in such a high-quality business
Growth Engines
I evaluate the return potential of any business through two engines running simultaneously.
The first engine is FCF per share growth, the fundamental driver of intrinsic value over time. For Pool, this engine has multiple components: the construction recovery adds to the revenue base as rates normalise; operating leverage on a cost structure maintained through the downturn amplifies earnings as revenue recovers; and a consistent share buyback programme reduces the denominator. Pool repurchased $341 million of its own shares in 2025 at prices well below any reasonable mid-cycle intrinsic value estimate. That per-share compounding is real and operates independently of the business cycle.
The second engine is valuation re-rating. At 15 years at the lower boundary of Attractive, this engine is beginning to work in the investor’s favour. An investor adding at current prices captures the construction recovery through fundamental earnings growth and the subsequent re-rating from attractive territory simultaneously. That combination, fundamental compounding plus valuation correction, is what the framework is designed to identify.
8. Risks
Where the Thesis Can Be Wrong
Cyclical Earnings Compression
This is the most important risk, and the one most often understated. EPS declined from a peak of $18.70 in 2022 to $10.85 in 2025, a 42% compression over three years, driven by the normalisation of pandemic-era construction demand and elevated financing costs. This will happen again. In the next significant economic downturn, Pool’s discretionary revenue segment will compress. Construction will slow. Renovations will be deferred.
A long-term investor can look through cycles if the business is structurally intact, and the evidence strongly suggests it is. But the volatility is real and must be understood before entering a position. Pool is more cyclical than a pure-maintenance business would be, precisely because 36% of revenues are discretionary. The cyclicality is a feature, not a bug, of a business that participates fully in the upside of construction booms. But it means the entry price matters considerably, and owning Pool at the wrong price through a downturn is a genuinely uncomfortable experience.
Inventory Pile-Up
Inventory days of 135 in 2025 are approaching decade-high levels. Management’s rationale, purchasing ahead of anticipated price increases, is a standard and historically successful practice for Pool. But the downside scenario is real: if anticipated price increases do not materialise, or if demand remains soft, Pool is carrying more inventory than it needs at cost prices that may be above what the market will bear. This could result in either margin compression on the sale of elevated-cost inventory, or in a worst case, write-downs. Pool’s reserve for inventory obsolescence was $23.9 million at year-end 2025, not alarming in absolute terms, but worth monitoring against actual write-off trends in coming quarters.
E-Commerce Structural Challenge
Amazon and direct-from-manufacturer purchasing represent a long-term structural question for wholesale distribution economics. Pool’s defence, same-day local delivery, 200,000 SKU breadth, POOL360 digital integration, is well-constructed and already working. But the question is not closed over a 20-year horizon. I monitor POOL360 adoption rates, gross margin trends, and any signals of customer defection as the most important leading indicators of this risk.
Tariff Exposure
Pool sources products from manufacturers globally, including Chinese-manufactured pool equipment. The current tariff environment introduces cost uncertainty that Pool largely passes through to contractors, but the timing mismatch between cost increases and price realisation creates quarterly earnings volatility. Inflationary product cost increases included a 1% tariff impact in 2025. The tariff environment remains dynamic and will continue to create noise in quarterly results.
Housing Market Dependency
New pool construction correlates strongly with housing market activity, home equity availability, and consumer willingness to take on debt for home improvement. In a scenario where housing prices decline significantly, from a broader recession or from housing-specific stress, the construction recovery thesis is delayed or reversed. Consumers who have seen home equity erode are unlikely to finance pool installations. This is the scenario where my normalised FCF estimate of $15 proves too optimistic in the medium term.
Normalised Earnings Uncertainty
The honest acknowledgment is that $15 per share as normalised FCF is an estimate, not a number readable from the financial statements. If structural operating cost inflation proves stickier than expected, or if the construction recovery is shallower or slower than my model assumes, the normalised earning power may settle lower. That is a risk I hold explicitly rather than papering over with a point estimate.
What Would Change My Mind
Persistent gross margin compression below 28% for two or more consecutive years, not explained by a temporary mix shift, would signal something more structural than a cyclical trough. A sustained reversal in POOL360 adoption rates. A major supplier announcing direct distribution capability at scale. EPS on a normalised basis, after rates decline meaningfully, failing to recover toward $14 to $15. Any of these would warrant a fundamental reassessment of the thesis.
9. The Verdict
Pool Corporation is Approved in the Bearhold Universe. The business has demonstrated over four decades that its scale advantages compound, its competitive position strengthens through economic cycles, and its maintenance revenue base is structurally permanent. The financial track record, ROIC consistently above 16% through a 42% EPS compression from peak to trough, gross margins stable at 29% to 30% throughout, is empirical evidence of a genuine and durable moat. The cyclicality of the business does not disqualify it from the Approved designation; what matters is that the moat itself has not weakened during the downturn.
At approximately $225 and 15 years of embedded cash flows, Pool sits at the lower boundary of the Attractive zone. I hold a position initiated prior to this publication.
What makes the current moment analytically interesting is this: Pool’s management is guiding for 2026 EPS in line with 2025 and explicitly assumes no recovery in new pool construction. The market is therefore pricing the business at trough earnings, with no meaningful premium for a recovery that, at some point, is structurally inevitable. The construction suppression is rate-driven and financial in nature, not a permanent structural loss of demand for pools. When rates normalise and construction recovers, the earnings recovery is expected to be significant, and investors who entered in the Attractive zone will capture both the fundamental compounding and the re-rating from trough levels.
The risks are real, cyclical earnings volatility, the inventory build, the long-term e-commerce question. None of them, assessed honestly against the quality of what has been built over 40 years and the price at which it is currently available, changes my view that Pool Corporation belongs in the Bearhold Universe.
Disclosure: The author holds a position in POOL. This report reflects the author’s personal views and is not an investment advice. Investing carries the risk of permanent capital loss. Read the full disclaimer here
Sources
Pool Corporation FY2025 Annual Report on Form 10-K (filed February 2026).
Pool Corporation Q4 2025 Earnings Presentation (February 19, 2026).
Pool Corporation company history at poolcorp.com.
P.K. Data, Inc., US in-ground pool installation data.
Realized we are looking at the same stocks. I have position in both Pool and Copart as well. Do you deem Heritage Supply (who is backed by Home Depot balance sheet) as a credible threat? Currently, Pool benefits from being the dominant leader. Will the competitive landscape become a case of 1A and 1B?