

Under The Hood, HCA Healthcare - $HCA
When Operational Excellence Meets Political Risk


The Outlook
Approximately one in every five Americans will enter a hospital this year. When they do, there is roughly a one in six chance they will walk through the doors of an HCA Healthcare facility. HCA operates 189 hospitals across 19 US states and England, with 50,459 licensed beds and approximately 320,000 employees. It generated $75.6 billion in revenue in 2025 and a return on invested capital, the percentage return earned on every dollar deployed into the enterprise, of 18.9%. For a capital intensive, heavily regulated industry, those numbers are exceptional. No for profit hospital company in the United States comes close.
The business was founded in Nashville in 1968 by Dr. Thomas Frist Jr. and entrepreneur Jack Massey on the conviction that professional management and shared infrastructure could transform a fragmented, inefficient hospital industry. That conviction has been validated by five decades of compounding. The Frist family, now in its third generation, with Thomas Frist III serving as Chairman of the Board, still owns approximately 32% of the company, a continuity of ownership and institutional purpose that has shaped the long term orientation of management throughout.
HCA’s competitive position is built on scale, market density, and institutional depth that no competitor has replicated. Its return on invested capital has averaged 16.7% over the past decade, a 7 to 9 percentage point premium over its nearest publicly traded for profit peers. Gross margins have expanded from 37.6% in 2015 to 41.5% in 2025. The cash generation of the business has grown consistently enough that, despite a decade of aggressive share repurchases funded partly through debt, the leverage ratio has improved from 6.4 times debt to operating cash flow in 2015 to 3.85 times in 2025.
REFERENCE
Key Terms
Several terms in this report are specific to the healthcare industry. The following definitions are intended to make the analysis accessible without interrupting it each time a term appears.
Admission
An admission is when a patient is formally checked into a hospital for at least one overnight stay. It is the primary unit of volume measurement in the hospital business, the equivalent of passengers for an airline. A related metric, equivalent admissions, adjusts this figure to also capture outpatient procedures, giving a more complete picture of total patient volume across both inpatient and outpatient settings.
Reimbursement
Hospitals do not set their prices freely. Most revenue is collected through reimbursement, the amount that insurers and government programmes agree to pay for a given service. Reimbursement rates vary widely by payer: government programmes typically pay at rates set below the cost of care, while private managed care plans negotiate higher rates. The mix of who is paying is one of the most important determinants of hospital profitability.
Medicare
Medicare is the US federal government’s health insurance programme for Americans aged 65 and over, and for certain disabled individuals. It is administered directly by the federal government and sets its own reimbursement rates by regulation.
Managed Medicare
Managed Medicare, also known as Medicare Advantage, refers to private health insurance plans that receive a fixed payment from the federal government to provide Medicare benefits to enrolled patients. Rather than the government paying hospitals directly, a private insurer manages the coverage and negotiates rates with hospitals on the government’s behalf. Managed Medicare typically pays hospitals somewhat better than traditional Medicare, which is why its growing share of the Medicare population is generally viewed as a modest positive for hospital operators. HCA derived approximately 18% of its 2025 revenues from Managed Medicare.
Medicaid
Medicaid is a joint federal state programme covering lower income individuals. Reimbursement rates are set by each state within federal guidelines and are typically the lowest of any payer category, often below the cost of providing care. Together, Medicare and Medicaid account for approximately 45% of HCA’s revenues.
Managed Care
Managed care refers to private health insurance companies, such as UnitedHealth, Cigna, and Aetna, that negotiate directly with hospitals on the rates they pay for procedures. These negotiated rates are typically the highest of any payer category, making managed care patients the most commercially valuable to hospital operators. HCA derives approximately 49% of its revenues from managed care and private insurers.
Supplemental Payments
Many states make additional payments to hospitals above their base Medicaid rates, to partially bridge the gap between what Medicaid pays and what care actually costs. These are called state directed payments or supplemental payments. For HCA, these represented approximately $6.2 billion of 2025 revenues. They are now under active pressure from federal legislation, and their expected gradual decline is the most important near term financial risk in this report.
At a Glance
Company: HCA Healthcare, Inc.
Ticker: $HCA · NYSE
Sector: Health Care
Industry: Hospital Operations & Health Services
Market Cap: $98.4 billion (at $438)
First Coverage: April 2026
FY2025 Revenue: $75.6 billion
This report reflects the author’s personal views and is not an investment advice. Investing carries the risk of permanent capital loss. Read the full disclaimer here
1. The Business
Hospital Corporation of America was founded in Nashville in 1968 by Dr. Thomas Frist Jr., a physician and former US Air Force flight surgeon, alongside entrepreneur Jack Massey. The founding premise was that the US hospital industry was unnecessarily fragmented, hundreds of independently managed facilities each reinventing the wheel on purchasing, staffing, and administration. Professional management and shared resources, applied at scale, could lower costs and improve outcomes. That premise has been validated across five decades of operation.
The company has passed through multiple ownership structures, a leveraged buyout (an acquisition financed primarily with debt rather than equity) in 1989, a return to public markets in 1992, a second and larger leveraged buyout in 2006 at $33 billion, and a re listing in 2011. Through each transition, the operating business was uninterrupted. HCA Healthcare, Inc. as it exists today was incorporated in Delaware in 2010 and listed on the New York Stock Exchange in 2011. The Frist family’s continued 32% ownership stake is a thread of institutional continuity running through every structure the business has had.
What HCA Does
HCA operates hospitals and related health care facilities. Patients arrive through emergency rooms, physician referrals, or scheduled procedures, receive care, and are discharged. HCA bills the relevant payer, Medicare, Medicaid, a private insurer, or the patient directly, for the services rendered. The margin between the cost of delivering care and the reimbursement received is the economic engine of the business.
As of March 31, 2026, HCA operated 189 hospitals: general acute care facilities, behavioural health hospitals treating mental health and substance use conditions, and rehabilitation hospitals. It also operated approximately 2,600 ambulatory sites of care, including freestanding ambulatory surgery centres, freestanding emergency rooms, urgent care centres, and physician clinics. These outpatient facilities are an increasingly important part of the network as medicine shifts toward procedures that do not require overnight hospital stays.
Geographic Structure
HCA organises its US operations into three geographic groups. The National Group covers hospitals across states including California, Tennessee, Virginia, and Nevada. The Atlantic Group covers hospitals concentrated in Florida, Georgia, and South Carolina. The American Group covers hospitals primarily in Texas, Colorado, and Louisiana. Eight hospitals in England are managed within the Corporate segment.
Florida and Texas together generated 51% of HCA’s total revenues in 2025. They are also the two fastest growing major US states by net domestic migration, Florida gained approximately 370,000 net new residents in 2024 and Texas approximately 230,000. Each new resident is a potential future patient. Florida’s above average share of residents over 65, the heaviest users of hospital services, creates structural demand that compounds quietly year after year regardless of the economic cycle.
Revenue Mix
Managed care and private insurers represent approximately 49% of HCA’s revenues, the commercially negotiated, higher paying category that drives most of the profitability. Medicare accounts for approximately 15% of revenues, with Managed Medicare adding a further 18%. Medicaid contributes approximately 8%, with Managed Medicaid adding 5%. Uninsured and other sources account for the remainder.
Embedded within the Medicaid figure is approximately $6.2 billion in supplemental payments from state governments, additional reimbursement above base Medicaid rates intended to bridge the gap between what Medicaid pays and what care actually costs. New federal legislation enacted in 2025 restricts these payments going forward. Their expected gradual decline is the most important near term financial risk in this analysis, and it is addressed in the Capital Allocation and Risks sections.
2. The Moat
HCA’s competitive advantage is scale driven operational superiority, the ability to deploy shared infrastructure, purchasing power, clinical data, and capital access across a hospital network that no competitor has matched in size or geographic density. This advantage was built over five decades, facility by facility, and it compounds with each passing year.
Consider what it means to be a private health insurer trying to offer a competitive plan for employers and families in metropolitan Houston. To offer meaningful network coverage across cardiology, oncology, emergency care, and surgical services, you need access to HCA’s Texas hospitals. Excluding them is not commercially viable, your members would be directed away from facilities they already rely on. So you negotiate. And in those negotiations, HCA’s network density is leverage. This dynamic repeats in every major market where HCA has built density. More density means stronger insurer relationships. Stronger relationships generate better reimbursement rates. Better rates fund further investment in facilities and physician recruitment. Better facilities attract more physicians, which drives more patient referrals. The cycle reinforces itself continuously.
Purchasing Scale
At $75.6 billion in annual revenue across 189 hospitals, HCA is the largest buyer of medical supplies, equipment, and pharmaceuticals in the for profit hospital sector. This purchasing scale translates into supplier terms that smaller operators cannot access at equivalent pricing. The gross margin expansion from 37.6% in 2015 to 41.5% in 2025, a 390 basis point improvement over a decade, reflects this purchasing leverage compounding over time.
Clinical Data Infrastructure
HCA has accumulated clinical outcome data from tens of millions of patient encounters across its entire network over decades. This allows the company to benchmark performance across all facilities, identify operational inefficiencies, and standardise best practices system wide, a capability that no regional competitor can replicate without comparable scale. The ongoing investment in a new enterprise wide electronic health record platform and an AI assisted nursing platform will materially strengthen this analytical foundation over the next several years.
Capital Access and Infrastructure Compounding
HCA’s scale gives it access to debt and equity capital markets on terms that smaller hospital operators cannot match. This access funds a continuous programme of facility construction, bed additions, physician practice acquisitions, and technology upgrades. For 2026, HCA has guided capital expenditure of approximately $5.1 to $5.4 billion, a figure that reflects not just maintenance of the existing network but deliberate expansion into high growth markets. Every dollar spent on this programme compounds the competitive advantage that took five decades to build.
Financial Evidence
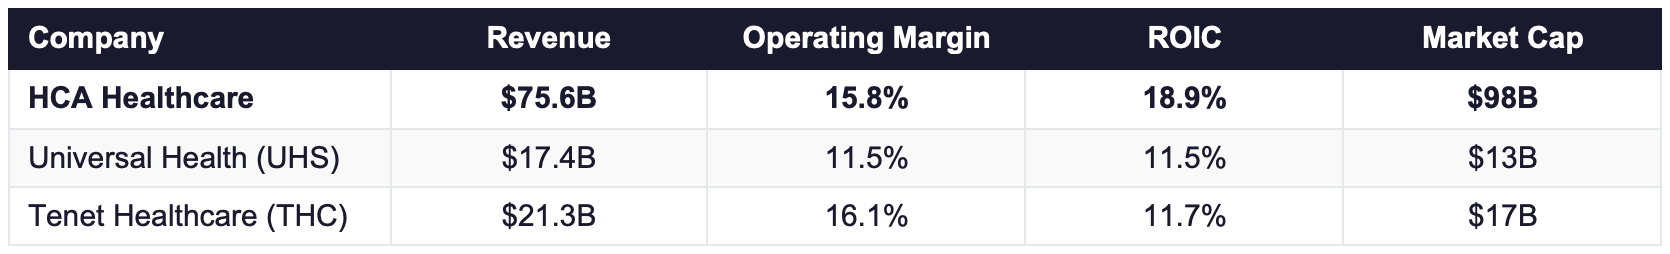
The most compelling financial evidence of the moat is the sustained ROIC gap relative to peers. HCA’s return on invested capital averaged approximately 16.7% over the decade from 2015 to 2025. Tenet Healthcare averaged approximately 7% ROIC over the same period. Universal Health Services averaged approximately 9%. A 7 to 9 percentage point ROIC premium, sustained for ten consecutive years in a capital intensive regulated industry, is the financial expression of a structural competitive advantage. The moat is stable to strengthening.
3. Financial Performance
The ten year financial record of HCA Healthcare reflects consistent operational excellence alongside a financial structure that demands careful reading. The table below presents key metrics across all available years from 2015 through 2025.
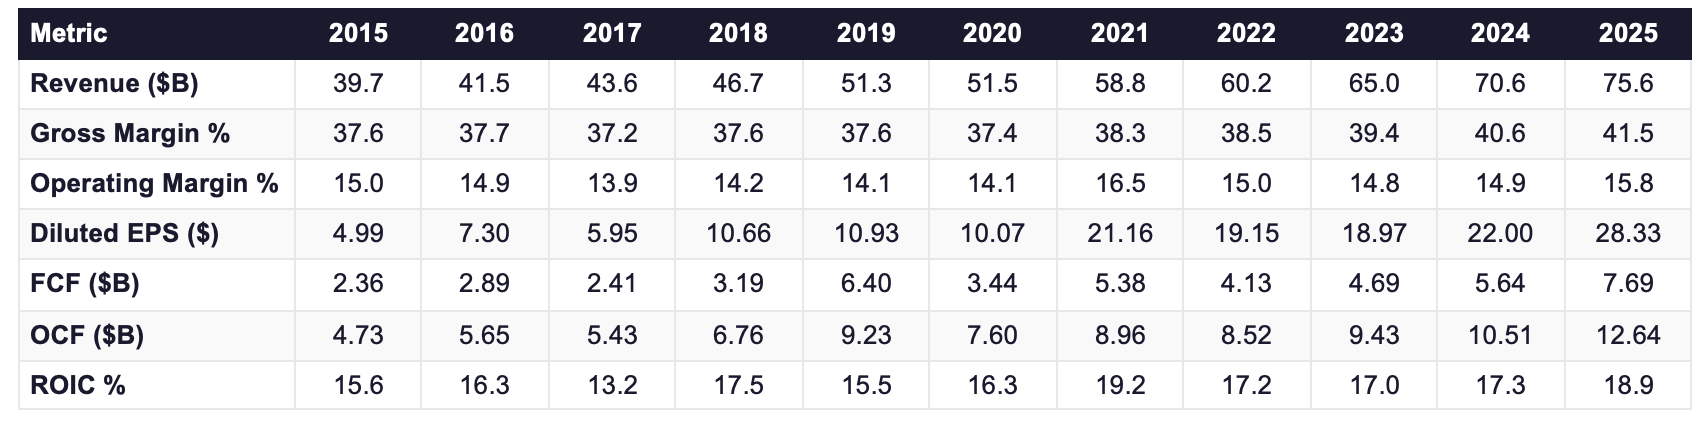
Revenue grew from $39.7 billion in 2015 to $75.6 billion in 2025, a compound annual growth rate of approximately 6.6%. The growth was driven by volume increases in admissions and equivalent admissions, price improvement from commercial contract renewals, geographic expansion, and the supplemental Medicaid payment programmes. In 2025, same facility revenues grew 6.6%, driven by 2.4% equivalent admissions growth and 4.1% revenue per equivalent admission growth.
The $6.2 billion in Medicaid supplemental payments embedded in 2025 revenues requires specific attention. New federal legislation enacted in 2025, referred to throughout this report as the FBA, or Federal Budget Act, restricts these mechanisms going forward. The Q1 2026 results, discussed in the update subsection below, indicate the near term impact is tracking materially better than initially feared.
Gross margin expanded from 37.6% in 2015 to 41.5% in 2025, a 390 basis point improvement over ten years. The direction of travel has been consistent throughout and reflects the compounding effect of better commercial contract pricing relative to the cost of delivering care. A business losing competitive ground does not expand gross margins at this pace.
Operating margin was 15.8% in 2025, above the decade average of approximately 14.8%. The peak in the available record was 16.5% in 2021, reflecting the combination of pandemic era volume and government support before the full labour cost inflation materialised. By 2022, the nursing shortage crisis had hit at full force, hospitals across the industry were forced to rely heavily on temporary travelling nurses hired on short term contracts at exceptional premium rates, inflating the industry wide labour cost ratio by an estimated 200 to 250 basis points and compressing operating margin to 15.0%. As that crisis resolved through 2023 and 2024, costs receded and margins recovered toward the current 15.8%. The current level is structurally sound, though it is worth noting that the labour cost ratio has not returned to the pre pandemic baseline of approximately 38% of revenues, the current level of approximately 43 to 44% represents a structural upward shift of several percentage points from the pre 2020 norm, which is relevant context for modelling the margin ceiling.
Diluted earnings per share grew from $4.99 in 2015 to $28.33 in 2025, a compound annual growth rate of approximately 19%. HCA’s revenues grew at 6.6% annually over the same period. The gap between 6.6% revenue growth and 19% EPS growth is almost entirely explained by the share buyback programme. HCA reduced its diluted share count from approximately 427 million in 2015 to approximately 240 million in 2025, a 44% reduction over the decade. The mechanics of how this reduction was funded are addressed in the Capital Allocation section.
Free cash flow, operating cash flow less capital expenditure, grew from approximately $2.4 billion in 2015 to $7.7 billion in 2025, a compound annual growth rate of approximately 12.4%. The trajectory has been consistently upward with one interruption in 2022 when elevated capital investment temporarily reduced FCF. The recovery was sharp: $4.7 billion in 2023, $5.6 billion in 2024, and $7.7 billion in 2025. I deduct stock based compensation of $401 million in 2025 as a real economic cost to shareholders. After this adjustment, normalised FCF is approximately $7.3 billion, or approximately $30.50 per share at the average 2025 diluted share count of 239.5 million.
ROIC of 18.9% in 2025 is the highest reading in the decade long record and comfortably above any reasonable estimate of the cost of capital. Averaged across the full decade, ROIC was approximately 16.7%. This consistency, through a global pandemic, an industry labour crisis, and sustained regulatory uncertainty, is the most reliable indicator that HCA’s competitive advantages are structural rather than circumstantial.
Q1 2026 Update
HCA reported its first quarter 2026 results on April 24, 2026. The full year financial analysis above is anchored to FY2025 annual figures, quarterly results are too noisy to anchor financial ratios on and are included here solely to confirm or challenge the annual thesis.
Volume was softer than the 2025 trend, with same facility admissions up 0.9% and equivalent admissions up 1.3%. Management attributed this directly to two temporary factors: respiratory related admissions declined 42% year over year following an unusually strong respiratory season in Q1 2025, and a winter storm in January disrupted operations in certain markets. Volumes improved progressively through the quarter. Full year 2026 guidance was reaffirmed without revision, projecting revenues of $76.5 to $80.0 billion and diluted EPS of $29.10 to $31.50.
The most important update concerns the supplemental payment headwind. The Q1 2026 results revealed that certain state supplemental programmes, Georgia’s grandfathering approval, the reinstatement of the ATLAS programme in Texas, and the ongoing benefit from the Tennessee programme, generated approximately $200 million more in adjusted EBITDA benefit than management had initially guided. Management revised their full year SDP net benefit decline to a range of $50 to $250 million versus prior year. The near term SDP risk is proving less severe than the cautious tone of initial management guidance suggested.
4. Capital Allocation
Capital allocation is the section that most clearly illustrates both the strength and the structural complexity of HCA’s financial model.
Between 2015 and 2025, HCA deployed capital in three primary ways. Capital expenditure accounted for approximately $41.2 billion, spent on new facilities, additional licensed beds, technology upgrades, and physician practice acquisitions. Share repurchases accounted for approximately $45.3 billion. Dividends accounted for approximately $4.5 billion. Together, these three uses of capital over the decade exceeded the cumulative operating cash flow the business generated during the same period. HCA was a net borrower to fund its capital return programme. Total financial debt, including all short term and long term debt and lease obligations, which represent fixed future cash commitments that behave economically like debt, grew from approximately $30.5 billion in 2015 to approximately $48.7 billion in 2025.
In 2025 alone, HCA repurchased approximately $10.1 billion of its own shares, the single largest annual buyback in the company’s history, while issuing approximately $3.3 billion in net new debt to help fund it. The diluted share count fell from approximately 262 million at the start of 2025 to approximately 240 million by year end, a reduction of approximately 9% in a single year.
The 19% annual EPS compound annual growth rate is real in the sense that shareholders who held HCA shares did see per share earnings compound at that rate. But the source of that growth deserves precise disaggregation. The underlying business, growing revenues at approximately 6.6% annually with operating leverage, generates perhaps 9 to 11% annual growth in total net income. The remaining 8 percentage points of EPS growth came from the mechanical effect of a shrinking share count. That share count reduction has been funded substantially through continuous new debt issuance.
The leverage picture at any single point in time is less informative than the trajectory over the full decade. The debt to OCF ratio started at 6.4 times in 2015 and ended at 3.85 times in 2025. That improvement happened despite the buyback programme running aggressively throughout the full period. OCF grew faster than debt in the majority of years. The interest to OCF ratio declined from 35.2% in 2015 to 17.8% in 2025. The business is carrying more absolute debt than a decade ago, but carrying it significantly more comfortably relative to what it generates. However, the structural dependency on government reimbursement, approximately 45% of revenues, means the OCF that underpins this improving ratio is itself subject to political and legislative risk. That dependency, not the leverage ratio in isolation, is the primary basis for the rejection.
The growth capex programme is the most strategically important use of capital in the HCA story. The $5.1 to $5.4 billion planned for 2026 represents the continued construction of the physical infrastructure moat, new facilities, additional licensed beds in high growth markets, expanded freestanding emergency rooms, and the enterprise wide technology overhaul. This is genuine competitive investment, not maintenance spending.
5. Competition
The for profit hospital industry in the United States has a clear competitive structure: one dominant national platform, two significantly smaller publicly traded operators, and a large network of not for profit and government owned systems operating under different financial constraints. HCA is the dominant platform by every relevant financial metric.
Universal Health Services
Universal Health Services (UHS) operates approximately 400 acute care and behavioural health facilities across the United States, the United Kingdom, and Puerto Rico, generating $17.4 billion in revenue in 2025. UHS maintains a conservative balance sheet relative to the sector and has delivered consistent EPS growth through operational improvement and a disciplined buyback programme. ROIC of approximately 11.5% in 2025 reflects a legitimate, well run operator that has nonetheless consistently trailed HCA by 7 to 9 percentage points over the decade. The gap is structural: UHS does not have HCA’s market density in high growth markets or HCA’s system wide purchasing and data advantages.
Tenet Healthcare
Tenet Healthcare operates approximately 60 hospitals alongside a large ambulatory care business, generating $21.3 billion in revenue in 2025. Tenet has spent the better part of a decade restructuring its balance sheet and divesting underperforming hospital assets. ROIC improved to 11.7% in 2025 following a decade average of approximately 7%, the weakest sustained performance among the major for profit operators. The 2024 results were significantly distorted by approximately $5 billion in gains from facility sales. Stripping those out, Tenet remains a business in operational recovery mode rather than a genuine competitive threat to HCA’s market position.
Not for Profit Systems
The most substantive competitive pressure HCA faces does not come from its for profit peers. Large not for profit integrated health systems, organisations like Ascension, CommonSpirit Health, and Advocate Health, operate in many of the same markets under materially different financial conditions. Not for profit hospital systems do not pay federal or state income taxes, can issue tax exempt bonds at lower rates, and receive philanthropic donations and government grants. These advantages are particularly significant in physician recruitment, the leading competitive indicator I monitor most closely.
6. Management
Samuel N. Hazen - CEO
Samuel Hazen has served as Chief Executive Officer since January 2019. He joined HCA in 1984 and spent his entire 41 year career within the organisation, progressing from hospital level financial roles through regional and group leadership before becoming President and Chief Operating Officer in 2016. His predecessor was also an internal promotion. HCA has never appointed an external CEO in its modern operating history, a reflection of both the institutional depth of the management bench and the genuine complexity of the role. Managing 189 hospitals, 320,000 employees, and hundreds of reimbursement negotiations across 19 states requires operational and regulatory knowledge that cannot be acquired quickly from outside the institution.
Hazen’s tenure since 2019 covers an unusually difficult operating period: COVID 19, the labour crisis of 2021 and 2022, the post pandemic normalisation, and the current regulatory headwinds around supplemental payments. The financial record through those years, ROIC consistently above 15%, gross margins expanding, no meaningful market share loss, reflects operational execution that is difficult to dismiss.
Ownership and Alignment
Samuel Hazen beneficially owned 2,164,071 shares of HCA common stock as of February 23, 2026. At approximately $438 per share, this represents approximately $948 million in personal wealth tied directly to the company’s long term performance. That alignment is genuine and material.
The broader ownership picture is shaped by the Frist family. Their holding vehicles, Frisco Holding II and Hercules Holding II, collectively represent the Frist Group, which owned approximately 32% of shares outstanding as of February 23, 2026, per the 2026 proxy statement. Thomas F. Frist III, grandson of co founder Dr. Thomas Frist Jr., serves as Chairman of the Board. The family retains the contractual right to nominate two directors for as long as they hold at least 3% of outstanding shares. All directors and executive officers as a group, 16 persons, beneficially own approximately 3,354,148 shares, or approximately 1.5% of outstanding shares. Including the Frist Group, total affiliated ownership is approximately 33 to 34% of the company.
Compensation
Hazen’s total direct compensation for 2025 was approximately $26.5 million. Base salary was $1.58 million, approximately 6% of total. Stock appreciation rights and restricted stock awards comprised approximately 64% of total compensation, creating multi year alignment with the share price. Annual performance cash through HCA’s Performance Excellence Programme comprised the remaining 30% and paid out at approximately 196% of target for 2025. For 2026, Hazen’s base salary was increased by 2.5% to $1,620,555. The compensation structure is appropriate: a CEO whose pay is predominantly variable and linked to long term share price performance has incentives pointing in the right direction.
7. Growth Levers & Addressable Market
Organic Volume in Sunbelt Markets
HCA’s geographic concentration in Florida and Texas is its most durable growth engine. These states are experiencing structural net population inflows that have persisted through multiple economic cycles. Each new resident is a potential future patient. Each ageing resident, Florida’s above average proportion of over 65s is a sustained structural tailwind, creates more intensive recurring demand for hospital services. The 2025 same facility admissions growth of 2.3% is consistent with this demographic compounding.
Revenue Per Admission Through Commercial Pricing
HCA’s most controllable near term growth lever is the rate at which it grows revenue per equivalent admission through managed care contract renewals. In markets where HCA holds network density, private insurers cannot construct a competitive health plan without including HCA facilities. This gives HCA structural pricing power at contract renewal that has consistently translated into revenue per admission growth of 3 to 4% annually. Even with the FBA reducing government reimbursement, the commercial pricing lever remains intact and partially offsets.
Outpatient and Ambulatory Expansion
The long term structural shift in healthcare from inpatient to outpatient settings is both a challenge and an opportunity for HCA. It is a challenge because outpatient procedures generate lower revenue per case than inpatient equivalents. It is an opportunity because HCA is investing aggressively in ambulatory surgery centres, freestanding emergency rooms, and urgent care facilities that capture patient volume at lower cost while maintaining the physician and patient relationships that drive future inpatient referrals.
Technology and Data Investment
HCA is deploying a new enterprise wide electronic health record platform across all hospitals and implementing an AI assisted nursing platform. The financial returns from this investment cycle will become visible in the 2027 to 2030 period. The competitive advantage it creates begins to compound from the moment of deployment: no regional operator can justify investment at this scale, widening the analytical and operational gap between HCA and its peers.
8. Risks
Political and Legislative Dependency
Approximately 45% of HCA’s revenues flow from government programmes, Medicare, Medicaid, and their managed equivalents, whose reimbursement rates are set by political and regulatory decisions rather than market negotiation. This is the central risk and the one that no management team, regardless of capability, can fully control or predict.
The concern is not only the current FBA supplemental payment restriction, which is quantifiable and tracking better than feared. The deeper concern is the structural nature of the dependency itself. A future administration pursuing aggressive Medicaid base rate cuts, reducing per admission payments rather than supplemental payments, would create a sustained, multi year margin compression with limited commercial offset. Unlike the supplemental payment mechanism, which affects a discrete and identifiable revenue layer, base rate cuts affect every government payer admission. The historical record shows that Washington has periodically used Medicare and Medicaid reimbursement as a lever for fiscal adjustment, the sequestration cuts of 2013, the managed Medicaid rate pressures of 2016 to 2019, and the FBA provisions of 2025 are all examples of this pattern. The frequency and unpredictability of these interventions, rather than any single event, is what makes the dependency uncomfortable as a long term holding.
The scenario I monitor most closely is a slow, multi year compression, where base reimbursement rates are held flat or increased below the rate of cost inflation for an extended period. This does not produce a visible crisis but gradually erodes margins in a way that is difficult to offset commercially and hard to identify clearly until the trend is well established. HCA’s commercial pricing leverage is real, but it has limits: managed care plans cannot pass unlimited cost increases to employers and individuals, and the ceiling on commercial rate extraction is lower than it might appear.
Exchange to Uninsured Payer Mix Shift
The expiration of enhanced premium tax credits at year end 2025, federal subsidies that had made exchange based private health insurance affordable for lower income Americans, has caused a portion of that population to lose coverage and become uninsured. HCA estimates that same facility exchange equivalent admissions declined approximately 15% in Q1 2026 versus the prior year, while uninsured equivalent admissions increased approximately 16%. An uninsured patient generates significantly less reliable revenue than a commercially insured patient, and may generate no revenue at all. This shift will persist through 2026 and beyond depending on federal policy, another dimension of the same structural dependency on government programme design that drives Risk 1.
FBA Supplemental Payment Restrictions
HCA received approximately $6.2 billion in Medicaid supplemental payments in 2025, representing approximately 8% of total revenues. The FBA restricts these mechanisms going forward: arrangements not grandfathered before July 4, 2025 face immediate limitations, and grandfathered arrangements will be reduced by 10 percentage points annually from January 1, 2028 until they reach legislatively defined caps. Management guided for a full year 2026 net benefit decline of $50 to $250 million, materially better than the cautious tone of initial guidance suggested, driven by Georgia’s grandfathering approval, the reinstatement of the ATLAS programme in Texas, and the ongoing Tennessee programme benefit.
The risk is real but the near term trajectory is better than feared. The longer term 2028 phase down remains intact and will create a more sustained headwind from that point. The scale of that headwind will depend on how many additional state programmes receive grandfathering approvals between now and January 2028, a variable that is genuinely uncertain and worth monitoring closely as the schedule approaches. What is clear is that the partial commercial pricing offset available to HCA, through its network density leverage with private insurers, means the net OCF impact will be smaller than the gross revenue decline in any scenario.
Leverage Interacting With Regulatory Risk
HCA carries approximately $48.7 billion in total financial debt against $12.6 billion in annual operating cash flow. The leverage is improving, the debt to OCF ratio declined from 6.4 times in 2015 to 3.85 times in 2025, and the interest burden relative to OCF has fallen from 35.2% to 17.8% over the same period. But the combination of this debt level with the structural government reimbursement dependency creates an interaction risk that neither element would produce independently. If OCF comes under sustained pressure from legislative action while the debt balance remains elevated, the financial margin for error narrows in a way that a business without this regulatory dependency would not face. A sustained reversal of the debt to OCF improvement trend, or a meaningful rise in the interest burden relative to operating cash flow, would intensify this concern materially.
Labour Market
The United States faces a projected shortage of 100,000 to 200,000 nurses by 2030, driven by an ageing nursing workforce and insufficient training pipeline capacity. The 2021 to 2022 period demonstrated how quickly the cost structure can deteriorate under supply constraints, HCA’s labour cost ratio rose by an estimated 200 to 250 basis points above pre-pandemic levels at the peak. The subsequent normalisation has been genuine, but the labour cost ratio has not returned to the pre pandemic baseline and likely will not. Any future supply disruption would compound upward from the current elevated starting point.
Legal and Compliance Exposure
HCA operates in a heavily regulated environment and faces several active legal matters. The most significant ongoing investigation relates to the Anti Kickback Statute and the False Claims Act, federal laws governing physician referral arrangements and billing accuracy. The Department of Justice is investigating whether HCA provided illegal incentives to physicians in exchange for patient referrals, and whether the company engaged in upcoding, meaning billing for more expensive services than were actually provided. HCA is cooperating with the investigation. The potential financial consequences are unknown. Additionally, in late 2025, a federal court granted final approval for HCA to settle a class action lawsuit arising from a 2023 data breach that affected approximately 11 million patients. The Mission Health litigation, the North Carolina Attorney General’s lawsuit against HCA over emergency and cancer care services at Mission Hospital, remains a significant ongoing legal risk. HCA also faces continuing scrutiny over billing practices related to trauma centre fees.
9. The Verdict
Exceptional Business. Structural Dependency We Cannot Ignore.
HCA Healthcare is Rejected in the Bearhold Universe. The designation has nothing to do with the quality of the competitive position, which is genuine and documented throughout this report. ROIC averaging 16.7% over a decade. Gross margins expanding from 37.6% to 41.5% over ten years. A leverage trend improving from 6.4 times debt to OCF to 3.85 times despite running one of the most aggressive capital return programmes of any major US company. A management team that has navigated a global pandemic, an industry wide labour crisis, and sustained regulatory headwinds without losing meaningful market share. The business earns every bit of the admiration directed at it.
The rejection is driven by the structural dependency on government reimbursement decisions that approximately 45% of HCA’s revenues are subject to. This is not a temporary risk that resolves with a single legislative outcome. It is a permanent feature of the hospital business model that creates a category of uncertainty, the decisions of politicians and regulators in Washington, that no management team can fully anticipate, control, or offset. The FBA supplemental payment restriction is one concrete manifestation of this dependency. The exchange to uninsured payer mix shift, driven by the expiration of federal premium tax credits, is another. The history of Medicare and Medicaid reimbursement is a series of periodic legislative adjustments, sequestration cuts, rate freezes, managed care expansion, supplemental payment restrictions, that have recurred across administrations of both parties for four decades.
The scenario I am most cautious about is a slow, grinding multi year compression where base reimbursement rates are held flat or increased below the rate of cost inflation. This is the version of the political risk that is hardest to identify in real time, hardest to offset commercially, and most damaging to a business carrying $48.7 billion in financial debt. HCA’s commercial pricing leverage is real, but it has limits, managed care plans cannot indefinitely absorb cost increases that government programmes push toward the commercial sector.
The leverage position, while improving, interacts with the regulatory dependency in a way that neither element would produce independently. A business with minimal debt can absorb a sustained government reimbursement headwind. A business with $48.7 billion in debt and $2.2 billion in annual interest costs has less room to manoeuvre when OCF comes under pressure from sources outside management’s control.
There is genuine respect in this analysis for what HCA has built. The competitive infrastructure, the management track record, and the demographic tailwinds in Florida and Texas make this a business worth monitoring. The Bearhold framework requires that the investment can be held with conviction through periods of regulatory turbulence. HCA cannot be held with that conviction given the structural nature and historical frequency of government reimbursement interventions. The designation stands until the dependency is structurally reduced or the regulatory environment becomes demonstrably more stable and predictable.
This report reflects the author’s personal views and is not an investment advice. Investing carries the risk of permanent capital loss. Read the full disclaimer here