

Under The Hood: Domino's Pizza - $DPZ
The Franchise Behind the World's Largest Pizza Empire

The Outlook
In 1960, twenty-two-year-old Tom Monaghan and his brother James borrowed $900 to buy a small pizza shop called DomiNick’s in Ypsilanti, Michigan, with Tom intending to use the income to fund his architecture studies. He never went back to architecture. He bought out his brother’s share, trading him a Volkswagen Beetle for his half of the business, dropped sandwiches from the menu, focused entirely on delivery to college campuses, and invented an insulated pizza box that could be stacked without crushing the pizzas inside. The model he built, make the same product consistently, deliver it fast, price it within reach of anyone, turned out to be not just a business but a replicable system. By the mid-1980s, nearly three new Domino’s franchises were opening every day. Sixty-five years later, that system operates in over 90 countries across 22,142 locations, and Domino’s has delivered 32 consecutive years of global retail sales growth in constant currency.
The business Domino’s operates today is almost entirely a franchise. Approximately 99% of stores are owned by independent franchisees who pay a royalty on every dollar of sales, contribute to a national advertising fund, and purchase their food ingredients through Domino’s own supply chain infrastructure. The company itself owns 262 stores in the United States. While the overall count has remained broadly stable over the decade, the strategic direction is toward franchise, the refranchising of the Maryland market in May 2025 being the most recent example, with company-owned stores serving primarily as operational laboratories and training grounds rather than profit centres. What Domino’s keeps is the brand, the system, and the royalty stream. What franchisees keep is the operating risk.
That structure creates an economic engine of unusual quality. Royalties arrive as a percentage of system-wide retail sales regardless of whether individual stores are profitable. When a new store opens anywhere in the world, the royalty income base expands at no incremental capital cost to the company. When same-store sales grow, royalty income grows proportionally.
The tension in the Domino’s story today is not about the franchise or the brand. It is about what the right price is to own them, and whether the growth levers available over the next decade can sustain the rate of per-share cash flow compounding that the last decade delivered. The United States is a mature market. International expansion continues but the low-hanging fruit of early market entry is largely harvested. The capital structure, approximately $4.8 billion in total debt against negative book equity, requires management and periodic refinancing. These are not disqualifying concerns. They are the context within which the investment case must be made honestly.
Key Terms
System-Wide Sales / Global Retail Sales
Global retail sales refers to total worldwide retail sales at all Domino’s stores, both company-owned and franchised. This is not revenue to Domino’s, it is the retail volume flowing through the entire system. Franchise royalties are calculated as a percentage of this figure. In 2025, global retail sales reached approximately $20.1 billion against consolidated company revenues of approximately $4.9 billion.
Same-Store Sales
Same-store sales growth measures the change in sales for stores open in both the current and prior comparable period. It is the clearest indicator of whether the brand is gaining or losing traction at the store level, independent of new unit openings. International figures are reported on a constant currency basis.
Asset-Backed Securitisation (ABS)
Domino’s finances its debt through an ABS structure in which subsidiaries securitise the royalty and supply chain cash flows and issue fixed-rate notes against those cash flows. The structure provides borrowing costs lower than conventional corporate debt but introduces covenants tied to cash flow coverage ratios and creates scheduled refinancing events at each note maturity.
At a Glance
Company: Domino's Pizza, Inc.
Ticker: $DPZ · NASDAQ
Sector: Consumer Discretionary
Industry: Restaurants / QSR
Market Cap: $11 billion (at $330)
First Coverage: May 2026
FY2025 Revenue: $4.94 billion
This report reflects the author’s personal views and is not an investment advice. Investing carries the risk of permanent capital loss. The author does not hold a position in DPZ. Read the full disclaimer here
1. The Business
Domino’s Pizza was founded in 1960 in Ypsilanti, Michigan and has grown into the largest pizza company in the world by store count and global retail sales. The company went public in 2004 and has operated as a publicly traded entity since. As of December 28, 2025, the system operated 22,142 stores across more than 90 countries, of which approximately 99% are franchised.
Consolidated revenue of approximately $4.94 billion in 2025 is divided across five reporting lines within three operating segments. Understanding the composition matters more than the total, because the economic quality of each stream is fundamentally different.
The supply chain segment is the largest at approximately 60.5% of consolidated revenue, generating about $2.99 billion in 2025 through the manufacture and distribution of dough and food ingredients to franchisees in the United States and Canada. This segment exists to support the franchise network, not to generate standalone returns, its margin reflects a distribution business, not a franchise business.
The U.S. stores segment contributed approximately $1.61 billion, comprising royalties and fees from franchisees, advertising contributions, and revenue from the 262 company-owned stores. Within this segment, U.S. franchise royalties and fees of $677.1 million in 2025 are the highest-quality revenue the company generates, collected as a percentage of franchisee sales with essentially no direct cost. The advertising contribution of $559.5 million is collected from franchisees and spent entirely on brand promotion with no margin contribution. It passes through the income statement as both revenue and expense, inflating the top line without adding any economic value to the company. The international franchise segment contributed $338.7 million in royalties from master franchisees outside the United States.
A U.S. franchisee pays Domino’s a royalty of approximately 5.5% of store retail sales, plus contributions to the national advertising fund. The company bears no capital responsibility for franchised stores. Franchisees finance their own build-outs and carry their own operating risk.
When same-store sales rise, royalty income rises proportionally. When a new store opens, royalty income increases with no additional capital outlay by the company. Global retail sales grew from approximately $9.9 billion in 2015 to approximately $20.1 billion in 2025, slightly more than doubling the royalty income base over the decade with no proportional increase in capital deployed by the company
Internationally, master franchisees pay Domino’s a royalty and take on responsibility for developing the brand within a defined geography. The largest, Domino’s Pizza Enterprises (DMP: ASX), operates across 12 markets including Australia, New Zealand, Japan, France, Germany, and several other European and Asian markets. As of year-end 2025, DMP operated approximately 3,524 stores, representing about 16% of the global Domino’s store count.
2. The Moat
Domino’s competitive advantage is built on three reinforcing pillars: a value equation that consumers trust and return to, a network density that makes the system structurally faster than competitors, and franchisee economics that sustain the investment required to keep both of those pillars intact. Each pillar can be tested against the financial record, a moat that cannot be demonstrated in the numbers is not a moat.
The Value Equation
Nobody orders Domino’s because they believe it is the finest pizza available. They order it because it delivers on every dimension simultaneously, reliably good, consistently fast, predictably priced, and available almost anywhere. That combination at scale is what creates the habit. A local pizzeria might produce a superior product. It cannot match the reliability of delivery time across thousands of locations, the pricing consistency, or the brand familiarity that decades of investment have built.
The financial evidence for this pillar is in the same-store sales record. Domino’s has grown U.S. same-store sales in the substantial majority of years over the past decade, including through the pandemic, through inflationary pressure, and through the rise of third-party delivery platforms that expose the brand to direct price comparison. The one meaningful period of same-store sales decline, 2022 through early 2023, was driven by identifiable external pressures: commodity driven menu price increases that disproportionately affected lower-income consumers, and a delivery driver shortage that degraded service times below the standard the brand is built on. When those pressures resolved, same-store sales returned immediately to positive territory, 3.0% in 2025. A brand with a structurally weakened value proposition does not recover that cleanly. The speed of the recovery is the evidence.
The brand itself reinforces the value equation. Recall was built over decades of advertising investment funded through franchise contributions of approximately 6% of sales, a pooled fund that no individual competitor can match in scale or consistency. That recall was tested severely in the late 2000s when the product was widely criticised. The company’s response in 2010, a public admission that the product was inadequate, followed by a documented recipe overhaul, produced one of the more notable brand recoveries in QSR (Quick Service Restaurant) history and demonstrated that the consumer relationship is based on trust that can be repaired when it is damaged honestly. That institutional willingness to confront reality rather than manage perceptions is a cultural characteristic that has defined how the company has operated since, and it is part of why the brand has held its position through multiple competitive cycles.
Network Density
Delivery speed is a function of store density. A market with high Domino’s store concentration serves customers faster than any competitor with fewer, more dispersed locations. This creates a self-reinforcing dynamic: denser networks produce better delivery times, better delivery times attract more orders, more orders justify more stores, more stores increase density further. In mature markets such as the United States, the density Domino’s has built is not replicable from scratch without a decade of sustained capital investment and operational losses during the build-out period.
The financial expression of this pillar is in the royalty yield on global retail sales. Domino’s extracts royalty income on approximately $20.1 billion of system-wide retail sales through 22,142 stores. A new entrant seeking to challenge this position would need to build a comparable store network to generate comparable delivery density, at franchisee investment levels of roughly $150,000 to $400,000 per store, the capital requirement for a 10,000-store network alone exceeds $1.5 billion at the low end, before accounting for the years of brand-building required to reach Domino’s order frequency. Network density is a moat that compounds with time and becomes more defensible precisely because it is expensive and slow to replicate.
Franchisee Economics
A franchise system is only as strong as the economics it delivers to its operators. If franchisees are not profitable, they stop investing, stop opening new stores, and eventually stop maintaining existing ones. The quality of the Domino’s franchise proposition is best evidenced by two facts: net store growth has been consistently positive for over two decades, and nearly all U.S. franchisees developed from within the system, beginning as delivery drivers or in-store operators before earning store ownership through the Franchise Management School programme.
That internal development pipeline is analytically significant. Franchisees who understand the Domino’s system from the inside are more likely to operate it correctly, maintain quality standards, and continue investing in their locations. It is also a natural selection mechanism; operators who struggle at the store level do not make it to ownership. The result is a franchisee base with above-average operational competence and genuine institutional alignment with the brand, because their entire career trajectory runs through it.
The supply chain infrastructure strengthens franchisee unit economics in a way that is often underappreciated. Domino’s manufactures and distributes the dough and key ingredients at scale, providing franchisees with food at prices that individual operators could not access independently. This built-in cost advantage makes the Domino’s franchise more economically attractive than alternatives where the franchisee bears full procurement risk, which in turn supports the continuous new unit openings that expand the royalty base.
Moat Assessment
The moat is stable. All three pillars are mutually reinforcing and have been tested by a difficult external environment. The competitive landscape has genuinely changed, third-party aggregators have made delivery available from any restaurant, which reduces the structural advantage of delivery availability itself and exposes the value equation to direct comparison. But the evidence from the financial record is that the value equation has held up in that environment. The 2025 same-store sales recovery, the decade-high operating margin, and the record FCF per share all point to a franchise that is generating stronger cash returns now than at any point in its history, despite operating in a more competitive delivery environment than existed a decade ago. That combination, more competition, better financial results, is the strongest possible evidence of a structural moat rather than a circumstantial one.
3. Financial Performance
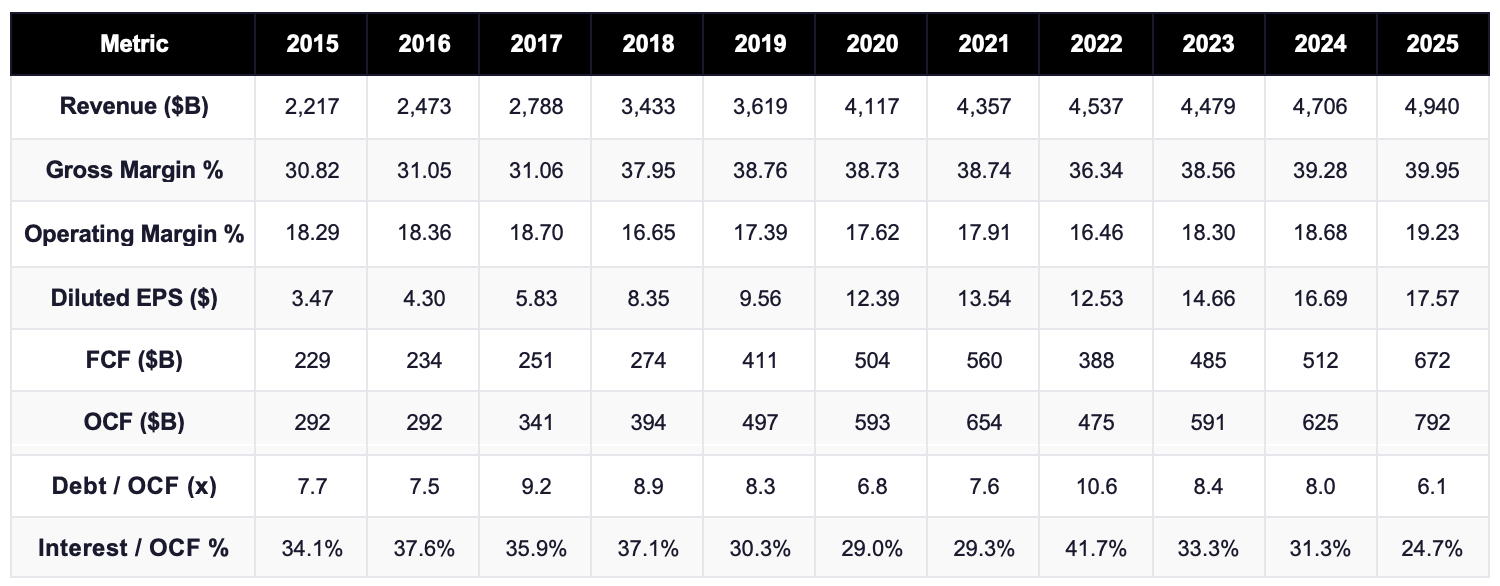
Revenue grew from $2.2 billion in 2015 to $4.9 billion in 2025, a 10-year CAGR of 8.3%. That headline number requires immediate disaggregation because the revenue mix is not uniform and the economic quality of each stream is fundamentally different. Supply chain accounts for approximately 60% of consolidated revenue but operates at an 11.5% gross margin. Franchise royalties, the economically important stream, account for approximately 20% of revenue excluding the advertising pass-through, but generate the vast majority of operating profit. Company-owned stores account for the remainder, broadly flat over the decade.
The contrast between the two non-supply-chain streams tells the story of the decade precisely. Company-owned store revenue was $397 million in 2015 and $375 million in 2025, essentially flat. Combined franchise royalties, U.S. and international, grew from $436.4 million in 2015 to $1,015.8 million in 2025, a 10-year CAGR of 8.8%, marginally above the blended revenue CAGR of 8.3%. Every dollar of meaningful revenue growth in the business over the decade came from the franchise model.
The 1.3% revenue decline in 2023 requires precise treatment. Supply chain revenue fell as commodity prices normalised from their 2022 peaks, the food basket price Domino’s charged franchisees declined proportionally, mechanically reducing the top line. But the underlying franchise business strengthened that year: operating margins expanded from 16.5% to 18.3%, net income grew from $452 million to $519 million, and operating cash flow recovered from $475 million to $591 million. Revenue fell while profitability improved sharply across every metric that matters. That divergence is the clearest possible signal that the consolidated revenue line was distorting the picture, 2023 was a better year for the business than 2022 by every measure of economic quality.
Operating margins have been stable in the 17–19% range for most of the decade, which is analytically significant in itself. A business that sustains margins in a narrow band across a decade that included a global pandemic, a commodity shock, a historic labour dislocation, and aggressive competitive entry from aggregator platforms is demonstrating genuine pricing power and cost discipline. The stability is the signal, not just the level.
The 2022 compression to 16.5% is the decade’s outlier. Three forces converged simultaneously. The food basket cost rose 13–15% driven by the Russia-Ukraine war, wheat, dairy, and fuel all spiked together. A post-pandemic labour dislocation created a driver shortage severe enough to produce an 11.7% decline in delivery sales at its worst point, eliminating a high-margin revenue stream precisely when costs were rising. And the company’s defensive response, aggressive promotional discounting through Boost Week and inflation relief deals, protected transaction volumes but compressed unit margins further. The confirmation that 2022 was exogenous rather than structural comes from the recovery: operating margins reached 18.3% in 2023, 18.7% in 2024, and 19.3% in 2025. If the compression had reflected a structural deterioration in competitive position or unit economics, the recovery would not have been this clean or this fast.
Diluted EPS grew from $3.47 in 2015 to $17.57 in 2025, a 10-year CAGR of 17.6%. That rate is 9.3 percentage points above the revenue CAGR of 8.3% and requires decomposition. Operating income grew from $405 million to $950 million, a CAGR of approximately 8.9%, consistent with the revenue growth rate and modest operating leverage. The gap between 8.9% operating income growth and 17.6% EPS growth is explained by the sustained reduction in diluted share count from 55.5 million to 34.2 million, a 38% decline, alongside tax rate changes over the period. The share count reduction is the dominant driver of the per-share amplification.
SBC-adjusted FCF per share grew from $3.80 in 2015 to $18.31 in 2025, a 10-year CAGR of 17.0%, nearly identical to the EPS CAGR of 17.6%. The alignment between EPS and FCF per share growth over a full decade is an important quality signal. It means earnings are not being manufactured through accounting choices that diverge from cash reality. The business earns what it reports.
The 2022 drop in FCF per share to $9.96, a 29% decline from the $14.10 peak in 2021, was more severe than the EPS decline of 7.5% in the same year. The divergence is explained by the capex cycle: capital expenditure rose from $87 million in 2022 to $105 million in 2023 as the company invested in supply chain and technology infrastructure during a period of operational stress. Higher capex compressed FCF independently of the earnings compression. The recovery in FCF per share was correspondingly faster once both earnings normalised and capex returned to its longer-run trend, FCF per share reached $13.40 in 2024 and $18.31 in 2025.
The 2025 OCF reading of $792 million, a 27% year-on-year increase, produced the highest FCF per share of the decade. That jump deserves scrutiny. A single-year OCF increase of this magnitude in a business growing revenue at 5% is unusual and typically reflects favourable working capital timing rather than a step-change in underlying cash generation. The accounts payable and accrued liabilities movements in 2025 were a meaningful contributor. I treat the 2025 OCF as directionally correct but modestly overstating the sustainable run-rate; normalised FCF per share is probably closer to $17 on a through-cycle basis.
Total debt has ranged from $2.2 billion to $4.8 billion across the decade, and the absolute level is less informative than the trend in debt relative to cash generation. The debt / OCF ratio started at 7.7x in 2015, peaked at 10.5x in 2022, and declined to 6x in 2025. Both historical peaks require context. The 2022 spike to 10.5x was driven by OCF compression during the margin crisis, the same event that drove EPS and FCF lower, not by new debt issuance. Both were recoverable and both recovered, confirming that the leverage metrics are a mirror of operating performance rather than an independent variable.
The interest / OCF ratio tells a cleaner story across the decade: from 34% in 2015 to 24.7% in 2025, an improvement driven entirely by OCF growth since interest expense has been remarkably stable in the $190 million range annually since 2021. That stability reflects the fixed-rate ABS structure, existing notes do not reprice as market rates move. The risk is forward-looking: the 2017 Ten-Year Notes ($940 million) and 2018 9.25-Year Notes ($379 million) carry anticipated repayment dates in July 2027, and refinancing at current rates will increase the annual interest expense. The September 2025 refinancing, $1 billion in notes at 4.93% and 5.22%, is the most recent reference point for what the 2027 event will likely cost. A $30–50 million annual increase in interest expense is probable, which will compress the interest / OCF improvement trend modestly but is not expected to reverse it given the current OCF trajectory.
4. Capital Allocation
Domino’s carries negative total stockholders’ equity of approximately negative $3.9 billion, the direct result of a series of leveraged recapitalisations in which the company borrowed against its securitised royalty cash flows and returned the proceeds to shareholders through special dividends and buybacks. The consequence is that book-based return metrics produce meaningless results for this business.
Since 2015, Domino’s has retired approximately 21.3 million shares, a 38% reduction in the diluted count, from 55.5 million to 34.2 million. The company repurchased approximately 785,000 shares in 2025 for approximately $358 million. In April 2026, the Board authorised an additional $1 billion repurchase programme, bringing total outstanding authorisation to approximately $1.29 billion.
The buyback programme is the single largest contributor to the gap between 8.3% revenue growth and 17.6% EPS growth over the decade. Operating income grew from $405 million to $950 million, a CAGR of approximately 8.9%. The gap between that and the per-share earnings growth rate is almost entirely explained by the share count reduction, a 38% decline from 55.5 million to 34.2 million shares, funded through a combination of operating cash flow and leveraged recapitalisations.
The forward contribution of the buyback programme is discussed in the Valuation section. What the historical decomposition establishes here is the distinction between the two sources of per-share growth: the operational engine, which grew at approximately 8.9% annually, and the capital return engine, which amplified that into 17.6% EPS growth per share. Both engines have been running for twenty years. Understanding which contributed what is essential to forming a credible view of what the next decade delivers, and why the forward estimate differs from the historical CAGR.
Dividends of $6.96 per share in 2025 represent approximately 38% of SBC-adjusted FCF, a conservative payout ratio relative to cash generation. Dividends have grown every year of the decade, from $1.24 per share in 2015, a CAGR of approximately 18.9% over the period. Interest expense has been stable at approximately $190-196 million annually since 2021, reflecting the fixed-rate ABS structure. The 2025 refinancing added approximately $1 billion in new notes at 4.93% and 5.22%, extending maturities while adding modest incremental interest cost. The 2017 Ten-Year Notes ($940 million) and 2018 9.25-Year Notes ($379 million) carry anticipated repayment dates in July 2027, the next scheduled capital structure event of consequence.
Capital expenditure has run between $59 million and $121 million annually over the decade, averaging approximately 2.5% of revenue. The franchise architecture keeps this number structurally low; the physical infrastructure of the system is built and maintained by franchisees, not by the company. Domino’s own capex is concentrated in supply chain facilities, and technology investment.
5. Competition
Pizza Hut
Pizza Hut, owned by Yum! Brands, is Domino’s closest global competitor by store count at approximately 19,900 locations. The brand has historically been stronger in dine-in and carryout than delivery, and its delivery infrastructure has lagged in most markets. The financial evidence for Domino’s competitive superiority is in the same-store sales comparison: Domino’s has consistently outperformed Pizza Hut on U.S. comparable store sales over the last several years. That gap reflects not just marketing but the underlying operational advantages, supply chain infrastructure, franchisee quality, and delivery system efficiency, that Domino’s has built and Pizza Hut has not matched.
Papa John’s
Papa John’s operates approximately 6,000 stores globally, roughly a quarter of Domino’s footprint. The cost structure differential is telling: Papa John’s operating margin of approximately 5% compares to Domino’s 19.3%, and the gap is not primarily explained by scale. Papa John’s carries higher food and labour costs as a percentage of sales, operates with less supply chain leverage, and has a franchisee base that has been less profitable on average than Domino’s, which limits new unit investment and therefore limits the store count growth that drives the royalty income base. It is not a credible threat to Domino’s system economics.
Third-Party Delivery Platforms
DoorDash, Uber Eats, and Grubhub have permanently changed consumer behaviour; ordering delivery now means choosing from every available restaurant simultaneously. This is genuinely a structural change, not a cyclical one, and it reduces the advantage of delivery availability that was one of the original pillars of the Domino’s brand. The financial evidence that this has not yet materially damaged Domino’s is in the 2025 results, 3.0% U.S. same-store sales growth and 19.3% operating margins in a fully aggregator-competitive environment. But the risk is directional and worth monitoring; Domino’s selectively joined Uber Eats in the United States in 2023–2024, which captured incremental volume but introduced a strategic ambiguity about the long-term mix between direct and platform orders. The commercial rationale is sound. The strategic consequence is discussed in Risks.
6. Management
Russell J. Weiner - Chief Executive Officer
Russell Weiner joined Domino’s in 2008 as Chief Marketing Officer, following a decade at PepsiCo including a Vice President of Marketing role for Colas at Pepsi-Cola North America. His career at Domino’s progressed through President of Domino’s USA (2014–2018), Chief Operating Officer and President of the Americas (2018–2020), COO and President, Domino’s U.S. (2020–2022), and Chief Executive Officer from May 2022. His 14-year tenure before the top job spans almost every element of the brand’s transformation, the recipe overhaul, the technology investment, the shift to a digital-first ordering model, and the acceleration of international growth. The institutional knowledge embedded in that tenure is a genuine asset; Weiner does not need to learn the business or the brand. He built significant parts of it.
Weiner’s direct ownership stands at approximately 110,764 shares including exercisable options as of fiscal year-end 2025. At the current price, this represents a meaningful personal stake relative to his salary, though modest relative to the company’s market capitalisation. Total insider ownership across all directors and executive officers represents approximately 0.89% of shares outstanding. There is no founder stake and no controlling shareholder. Vanguard holds approximately 11.5% of shares, Berkshire Hathaway approximately 10.0%, BlackRock approximately 6.7%, and T. Rowe Price approximately 6.2%. Berkshire’s position is notable as a signal of quality recognition from a long-horizon institutional investor that is selective about franchise businesses.
Approximately 91% of Weiner’s target total direct compensation is variable: 18% annual cash incentive and 72% long-term equity. The equity mix is 55% performance-based restricted stock units, 25% stock options, and 20% time-vesting RSUs. PSU vesting is tied to three-year Consolidated Adjusted EBITDA growth and global retail sales growth, with a relative TSR modifier versus the S&P 1500 Restaurants Sub-Index. The heavy equity weighting creates genuine alignment, Weiner’s wealth is predominantly tied to the stock price over multi-year periods. The incentive metrics are EBITDA-based and do not penalise capital expenditure or stock-based compensation, which means management is not directly incentivised to minimise these costs. At current capex levels of approximately 2.4% of revenue, this is a modest structural concern rather than an immediate issue.
7. Growth Levers & Addressable Market
International Unit Expansion
International net store growth of 604 units in 2025, against a base of approximately 14,352 stores at year-end 2024, represents a growth rate of approximately 4.2%. This is the most direct and highest-conviction growth lever available because the economics are straightforward; each new franchised store generates an incremental royalty stream at negligible marginal cost to the company, and the store count grows on the franchisee’s capital, not Domino’s. The royalty income contribution from each new international store is small individually but compounds materially across hundreds of openings per year.
To quantify the contribution; if international same-store sales are flat and 600 new stores open annually, each averaging approximately $670,000 in annual retail sales at a 3% royalty rate, the incremental royalty income to Domino’s Inc. from new stores alone is approximately $12 million per year. That is a modest annual addition in isolation, but it compounds, each year’s cohort of new stores matures to higher sales volumes in subsequent years, and 600 openings annually over a decade builds a royalty base that is structurally larger than what exists today. The value of international unit growth is real but it is a long-duration compounder, not a near-term earnings driver
U.S. Same-Store Sales and Unit Expansion
The U.S. business delivered same-store sales growth of 3.0% in 2025 following a difficult 2022–2023 period. At a 5.5% royalty rate on approximately $9.9 billion in U.S. retail sales, a 1 percentage point increase in same-store sales generates approximately $100 million in incremental retail sales and approximately $5.5 million in incremental royalty income. The lever is real but not large on an absolute basis, its importance is as a compounding contributor to the royalty income base rather than a step-change generator. With approximately 7,186 domestic stores and management identifying potential for continued net unit growth in the low hundreds annually, each new domestic franchise store adds royalty income at no incremental capital cost to the company.
International Same-Store Sales Recovery
International same-store sales growth of 1.9% in 2025 was an improvement but remains below the historical average. The largest international master franchisee, Domino’s Pizza Enterprises (DMP: ASX), has been under pressure in certain markets including Japan and France, where competitive intensity and consumer affordability constraints have weighed on unit economics. A recovery in international same-store sales toward the historical 2–4% range would provide meaningful royalty income uplift across the 14,956-store international base. At a 3% royalty rate on approximately $10 billion in international retail sales, a 1 percentage point improvement in same-store sales generates approximately $100 million in incremental retail sales and approximately $3 million in incremental royalty income, again, a compounding contributor rather than a step-change.
8. Valuation
The future return on Domino's stock is a function of two engines; the future growth in free cash flow per share plus any valuation re-rating. Both are explained below:
Engine 1: Fundamentals
The first engine is the business itself. FCF per share grows over time through revenue expansion, operating leverage, share count reduction from buybacks, and the structural margin tailwind from refranchising. For Domino’s, I estimate FCF per share growth of approximately 8% annually over the next decade. That estimate is built from two components that have been quantified through the analysis in this report rather than assumed.
The operational component is approximately 5% annually. International unit growth of approximately 600 stores per year generates roughly $12 million in incremental annual royalty income at an average store retail sales of $670,000 and a 3% master franchisee royalty rate. U.S. same-store sales growth of approximately 3% on a $9.95 billion retail base at a 5.5% royalty rate adds approximately $16 million in incremental royalty income annually. The refranchising of remaining company-owned stores adds a modest margin improvement as lower-margin operational revenue converts to higher-margin royalty income. Combined, these levers produce approximately 5% organic FCF growth, a modest but honest rate that reflects the maturity of the U.S. market and the master franchisee layer that sits between Domino’s Inc. and individual store operators in most international markets.
The capital return component adds approximately 3 percentage points. Domino’s has retired shares continuously since 2005, twenty years of uninterrupted execution through multiple interest rate cycles, a pandemic, a commodity shock, and a labour crisis. The programme has not been interrupted once. The financial position today supports its continuation: the interest / OCF ratio has improved from 38% in 2016 to 25% in 2025, and the debt / OCF ratio has declined from its 2022 peak of 11.3x to 6.3x in 2025. Whether the outstanding share count is 55 million or 34 million is irrelevant to the sustainability of the programme, retiring 2–3% of whatever count is outstanding annually produces the same per-share amplification effect, and the cash generation to fund $300–400 million in annual buybacks is not in question at current OCF levels.
The combined 8% estimate is not conservative and it is not optimistic. It is the rate the business can sustain when the growth levers are quantified honestly and the buyback contribution is given its proper analytical weight alongside the operational growth rate.
Engine 2: Valuation Re-Rating
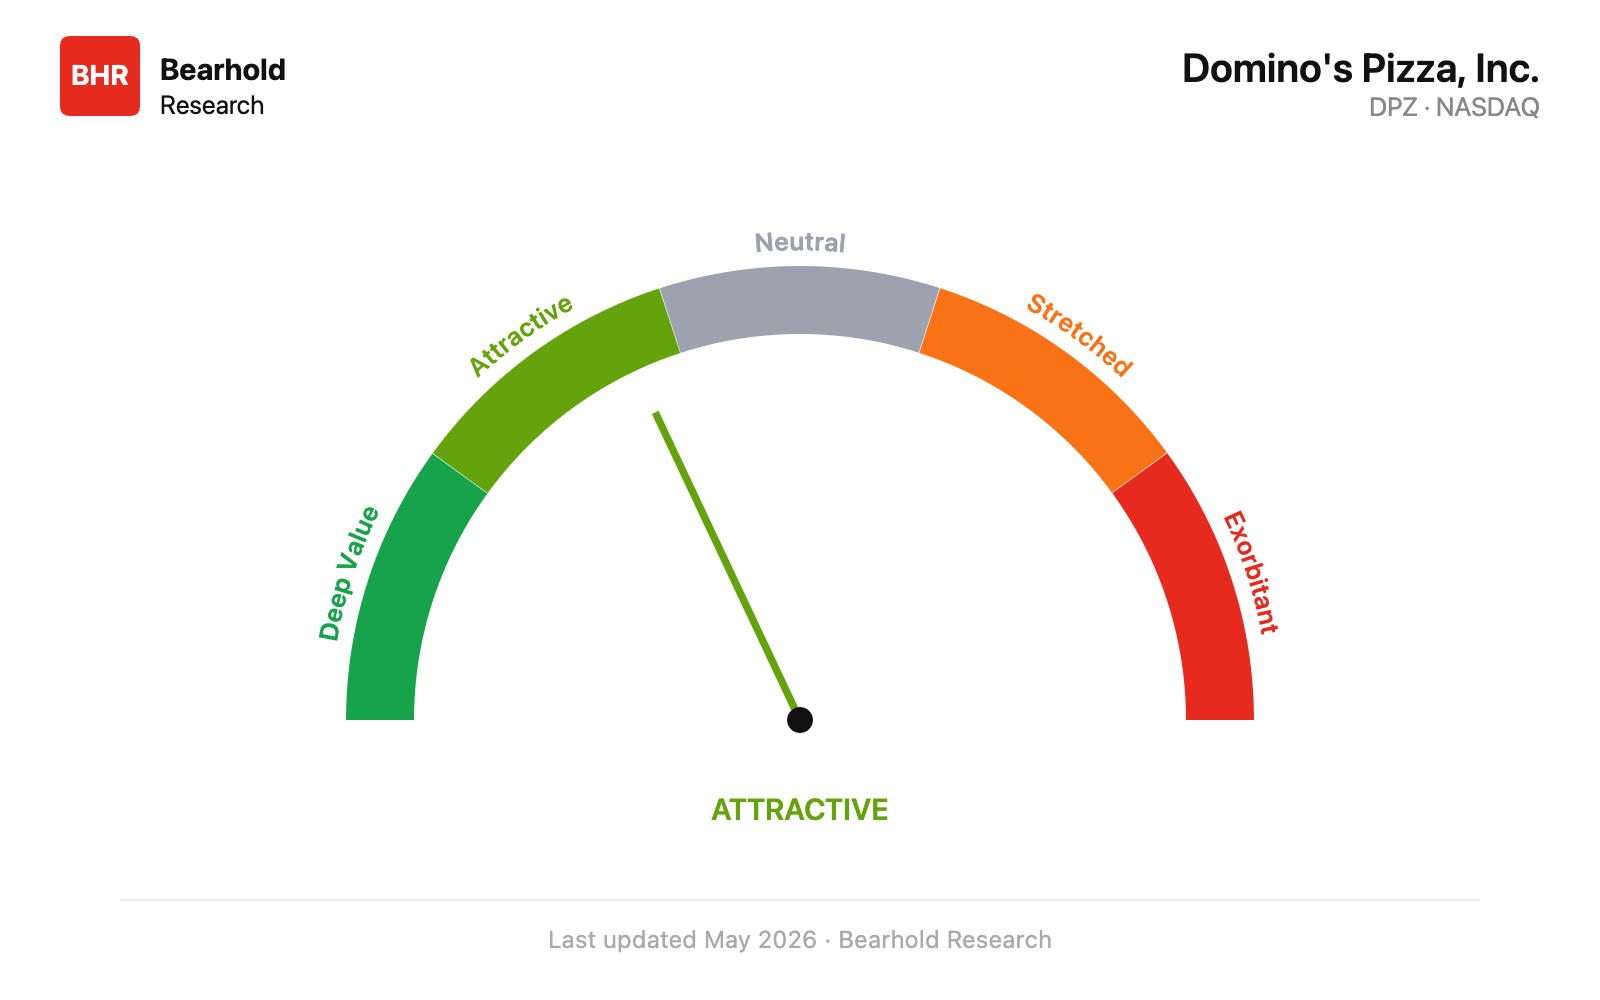
At today’s price of approximately $330, the investor is paying for everything this business will earn over roughly the next 19 years, in today’s money. Everything it earns beyond that point comes to you for free. The fewer the embedded years, the more of the future you receive without paying for it.
Domino’s sits in the Attractive zone. The expected return is the 8% fundamental growth rate plus a partial upward revaluation as the market prices in a longer earnings horizon over time. There is a decent margin of safety at this price for this type of business.
The Attractive zone does not mean the price cannot go lower in the near term, it means that at this price, the investor is not depending on a heroic growth assumption or a valuation re-rating to generate a reasonable return. The 8% fundamental growth delivers a reasonable return on its own. The partial re-rating is additional.
For a detailed explanation of how this valuation framework works and the thinking behind it, please check A Comprehensive Guide to Business Valuation
9. Risks
Commodity Costs, Particularly Cheese
The supply chain segment sells a food basket to franchisees at prices that move with commodity markets. Cheese is the single largest variable input, Domino’s explicitly identifies it as the primary commodity exposure in its market risk disclosures, and it carries the most direct and immediate impact on supply chain margins. A sustained increase in cheese prices creates pricing pressure that the company must either absorb or pass through to franchisees.
If the cost increase is passed to franchisees, unit economics weaken. Weaker unit economics reduce franchisee investment appetite, slow new store openings, and can accelerate closures, all of which directly reduce the royalty income base that drives the company’s value. If the cost increase is absorbed by the company, operating income declines directly. The 2022 experience, food basket costs up 13–15% driven by the Russia-Ukraine commodity shock, showed how quickly this mechanism works; operating margins fell from 17.9% to 16.5% in a single year, EPS declined, and FCF per share fell by 29%. That was a one-year commodity event. A multi-year structural increase in cheese or wheat prices, from climate disruption, supply concentration risk, or sustained feed cost inflation, would create a more persistent margin headwind than the 2022 episode and would be harder to recover from. The ABS covenant structure requires sustained OCF generation at levels sufficient to service the debt; a severe and prolonged commodity shock that compresses OCF meaningfully would narrow the financial flexibility available at the 2027 refinancing.
2027 Refinancing and Leverage
The 2017 Ten-Year Notes ($940 million) and 2018 9.25-Year Notes ($379 million) carry anticipated repayment dates in July 2027, creating a near-term refinancing event in a rate environment materially higher than when those notes were originally placed at rates of approximately 3.8–4.5%. The September 2025 refinancing, $1 billion in new notes at 4.93% and 5.22%, establishes the most current reference point for what the 2027 event will likely cost. Replacing $1.3 billion in notes at an average incremental rate of 50–100 basis points above their original coupons would increase annual interest expense by approximately $7–13 million. That is manageable at current OCF levels. The more significant risk is the combination; higher refinancing rates occurring simultaneously with a commodity-driven OCF compression, or a same-store sales deterioration. In isolation, the 2027 refinancing is a known and manageable event. In combination with a cyclical operating downturn, it would compress the debt / OCF ratio and potentially trigger closer scrutiny of the ABS covenants, which require a minimum coverage ratio of 1.75x total debt service to securitised net cash flow.
Aggregator Channel Erosion of the Direct Relationship
Domino’s selectively joined the Uber Eats platform in the United States in 2023–2024 to capture volume from consumers who order exclusively through aggregators. The commercial rationale is to grow total order volume by reaching a segment of consumers who would not otherwise order directly. But the strategic consequence is a structural shift in how consumers discover and order from the brand.
Domino’s built its competitive position around the direct ordering relationship, first-party customer data, commission-free unit economics, and the habit of going to Domino’s directly rather than browsing a platform. Each of these advantages erodes when a meaningful share of orders flows through an aggregator. First-party data advantages diminish as aggregators capture the ordering behaviour. Unit economics compress as commission fees of 15–30% apply to platform orders. And the habit of direct ordering weakens as consumers normalise the aggregator interface as their primary food discovery mechanism. The current financial evidence does not yet show these effects: 2025 operating margins are at a decade high. But the aggregator channel is growing, and the financial damage from habit erosion typically lags the strategic concession by several years. If aggregator-sourced orders grow beyond a threshold where they materially affect unit economics or same-store sales contribution, the margin trajectory would inflect downward in ways that would not be visible in the near-term data.
Shift in Consumer Taste
Domino’s is a single-category operator. The entire business is built around the consumer’s appetite for pizza, and specifically for delivered pizza. A sustained shift in dietary preferences, toward healthier options, different cuisines, or cooking at home, would reduce the frequency of the Domino’s order occasion regardless of how well the franchise executes. This risk is the longest-dated and hardest to quantify of the four, but it is structurally real and carries no operational hedge.
The QSR industry has watched several once-dominant categories lose relevance over decades as consumer preferences evolved, the decline of traditional fast food burgers in the early 2000s, the pressure on carbonated beverages from water and energy drinks, the gradual erosion of certain breakfast formats. Pizza has proven more durable than most QSR categories, partly because the format adapts well to both delivery and carryout, and partly because the price point remains competitive against alternatives. But Domino’s has no meaningful product diversification to offset a structural decline in pizza consumption frequency. Its brand, its supply chain, its franchisee network, and its entire operational infrastructure are built for one product category. If that category declines, there is no pivot available. The risk probability is low on any near-term horizon, but the consequence, a gradual and permanent reduction in global retail sales volumes, would directly reduce the royalty income base in a way that no management action could fully offset.
Master Franchisee Restructuring
Domino’s Pizza Enterprises (DMP: ASX) is the company’s largest master franchisee, operating approximately 16% of the global store count across 12 markets and contributing approximately 20% of Domino’s international franchise royalty income. The concentration in a single franchisee relationship of this scale creates a risk that is not visible in the headline disclosure, Domino’s Inc. reports DMP royalties as approximately 1.4% of consolidated revenues, which frames the relationship as immaterial when it is in fact the single most important bilateral relationship in the international business.
DMP is in active restructuring across two of its largest markets. The root cause in Japan was a capital allocation failure, not a rejection of the product. DMP opened a net of 403 stores in Japan between 2020 and 2023 during a period of pandemic-elevated delivery demand. When post-pandemic consumer behaviour normalised, a large portion of those stores could not generate sufficient sales to sustain the advertising investment required to make the Domino’s model work, lower sales reduced advertising funds, lower advertising reduced new customer acquisition, and declining customer counts further compressed store economics in a self-reinforcing cycle. DMP closed 233 stores in Japan in FY2025, following earlier rounds of closures in Japan, France, and Denmark. Total store closures across the group in FY2025 reached 312, incurring AUD $162.3 million in significant costs that drove the group to a statutory net loss of AUD $3.7 million despite an underlying EBIT of AUD $198.1 million. France closed 32 additional stores, is facing franchisee legal action, and appointed its third CEO in recent years. Japan is currently operating under an interim CEO while a permanent replacement with deep local expertise is recruited.
The financial risk to Domino’s Inc. operates through two channels. The first is direct and permanent: every store that closes eliminates a royalty stream that does not return. At average store retail sales of approximately $670,000 annually and a 3% royalty rate, the 312 stores closed in FY2025 reduce annual royalty income to Domino’s Inc. by approximately $6.3 million. That is not catastrophic in isolation, but the closures are permanent and the pace, 312 in a single year across a 3,500-store network, represents a 9% contraction of the network in twelve months. The second channel is indirect: DMP’s financial capacity to reinvest, fund marketing, support franchisees, and resume growth is constrained by the restructuring costs and by the earnings trajectory. Free cash flow fell to AUD $47.4 million in FY2025, down AUD $56.7 million year-on-year. A financially constrained DMP is a DMP that opens fewer new stores, which directly reduces the royalty income growth that underpins the international expansion thesis.
The distinction between a mismanagement failure and a demand failure matters for how permanent this risk is. Japan is a genuine pizza market with decades of Domino’s presence. Germany is achieving record weekly sales. Benelux recorded national sales records in FY2025. Australia delivered its highest franchisee profitability in three years. The evidence from DMP’s own portfolio shows that the Domino’s brand works when the store network is correctly sized and the unit economics are healthy. The failure in Japan and France was in the decision to expand aggressively into locations that could not support profitable operations at steady-state demand. That is correctable, but the correction takes years, reduces the royalty base in the interim, and creates leadership instability at the market level in both Japan and France simultaneously. For a franchisee that accounts for 20% of international royalty income, the timeline of that recovery is a material variable in the Domino’s Inc. investment thesis.
10. The Verdict
Domino’s earns Approved status on the strength of a franchise system that has demonstrated genuine competitive durability across a full decade and through a period of serious adversity. The case for the quality of this business rests on three things; the financial record, the recovery from 2022, and the structural economics of the royalty model.
The financial record is unambiguous. FCF per share compounded at 17.0% annually from 2015 to 2025. EPS grew at 17.6%. Global retail sales more than doubled. The blended operating margin held in a narrow 17–19% range through commodity shocks, a pandemic, a labour crisis, and the rise of aggregator platforms. A business that sustains those results across a decade of significant external disruption is not doing so by accident. It is doing so because the underlying competitive advantages, the value equation, the network density, the franchisee economics, are structural and self-reinforcing.
The 2022 recovery is the most analytically important single data point in this report. The year was genuinely bad; operating margins fell to 16.5%, EPS declined from $13.54 to $12.53, and FCF per share fell 29% from its 2021 peak. Three independent external shocks hit simultaneously, a commodity cost surge, a labour market dislocation that crippled delivery capacity, and an inflation-driven demand reduction among the price-sensitive consumer segment that Domino’s relies on most. Under that combination of pressures, a franchise with a structurally weakening competitive position would have struggled to recover. Domino’s recovered in a single year. By 2023, operating margins had already returned to 18.3%. By 2025, they had reached 19.3%, the highest of the decade. The speed and completeness of the recovery is the proof of structural quality, not just the 2025 results in isolation.
The royalty model’s economics deserve specific acknowledgment in the Verdict because they are what makes Approved the right designation despite the leverage and the competitive changes around aggregators. International franchise segment income of $288.5 million on $338.7 million in revenue, an 85.2% segment margin, is the financial expression of what it means to own a brand that the world pays royalties to use. That margin does not come from operational efficiency or cost management. It comes from the structural position of being the brand that 14,956 international stores pay to operate under. Adding 600 stores per year to that network, each paying a royalty on every dollar of sales, is a compounding mechanism that is independent of commodity prices, labour markets, or aggregator strategies.
The risks are real and have been stated plainly. Cheese prices can spike in ways that damage franchisee economics and compress the company’s margins. The 2027 refinancing will cost more than the notes it replaces. The aggregator partnership introduces a strategic ambiguity that did not exist five years ago, and its long-term consequence for the direct ordering relationship is genuinely uncertain. A structural decline in pizza consumption frequency would reduce the royalty base in ways no management team could offset. None of these risks individually, or even collectively in a realistic scenario, changes the Approved designation. The franchise quality is above the threshold, and the risks are risks to the return, not to the fundamental business model.
The business quality is not in question and the current price offers a decent margin of safety. At $330, this is a high-quality franchise available at a price that does not require a heroic growth assumption or a perfect execution outcome to generate a reasonable return. The 8% FCF per share growth estimate is built from quantified components: approximately 5% from the organic royalty income growth across U.S. and international markets, plus approximately 3 percentage points from a buyback programme that has run without interruption for twenty years. An investor who owns Domino’s at this price is buying the fundamental growth rate plus a partial re-rating, which is precisely what the Attractive zone is designed to capture.
This report reflects the author’s personal views and is not an investment advice. Investing carries the risk of permanent capital loss. The author does not hold a position in DPZ. Read the full disclaimer here
Another great piece, thank you Omar!
I made it 2% of my portfolio at 400. Down 22% now. Should I hold or cut my losses?