




Before getting into any numbers, it’s worth being upfront about what this is and isn’t.
Copart is a name Bearhold covers, and it’s currently a position in both the Bearhold model portfolio and my own personal portfolio
This report is an attempt to understand what autonomous vehicles (AVs) mean for Copart’s business, and to do that honestly, we have to work through the problem in two stages. First, we need a grounded view of where AV technology and adoption are actually headed, not the hype-cycle version, but a reasonable read on the pace of change.
Only once we have that can we ask the second question, how does that AV trajectory ripple through the auto insurance industry, and from there, into Copart’s salvage and auction business, over time.
No one has a crystal ball when modeling a multi-decade technological transition. The assumptions used throughout this report; adoption curves, cost declines, total loss rates, fleet turnover; are built on the best available data, but they remain projections with error bars that widen the further out we look.
The goal is to figure out, as objectively as possible, whether AVs represent an existential threat to Copart, a drag, a catalyst, or something that shifts character entirely depending on which decade you’re looking at. The honest answer, as you’ll see, is “it depends on the time horizon”. And I’ve tried to lay out the reasoning, so you can judge the assumptions for yourself.
One more note before diving in; this is an analytical exercise, not investment advice. Copart is a publicly traded company (NASDAQ: CPRT), and nothing here should be read as a recommendation to buy, hold, or sell its stock. It’s a framework for thinking about a structural risk, built on projections that are inherently uncertain.
Executive summary
For over a century, auto insurance and salvage were built around human driver error. As control shifts to software, sensors, and commercial AV fleets, two forces move in opposite directions at once as explained below:
Fewer crashes reduce the raw pool of vehicles entering the claims pipeline, that’s the drag. But the vehicles that do crash are increasingly loaded with expensive perimeter sensors, LiDAR, and high-voltage battery packs, which pushes a rising share of them past the total-loss threshold, that’s the catalyst.
For Copart, whose engine is essentially volume times price on total-loss units, the verdict this report lands on is a two-part one. Over the next decade, the data points to a positive impact, rising total-loss frequency and improving vehicle quality look set to outweigh the gradual decline in raw accidents. In the long term, the data points to accident volumes diminishing sharply enough that the current accident-salvage model can’t carry the business on its own, Copart will need to actively become something more than a salvage auctioneer to stay viable, and even then, the size, growth rate, and margin profile of that future business aren’t yet knowable. The full case for both halves is below.
Part 1: Where autonomous vehicles are actually headed
Let me first start with the obvious, there’s a big difference between driver-assistance features that are already common (adaptive cruise control, lane-keeping, automatic emergency braking, what’s usually called Level 2 or “L2+”) and genuine autonomy, where the car is making driving decisions without a human ready to take over (Level 3 and above).
L2+ features are already mainstream. A meaningful share of new vehicles sold today come with some version of this technology standard, and that share is climbing quickly. True high-autonomy vehicles, L3 “eyes off” systems and L4 robotaxi-style fleets, are much earlier in their curve. They exist today in limited, geofenced deployments (think Waymo in a handful of cities), but broad consumer availability is still a matter of years, not months.
The working assumption in this report is that L2+ penetration in new vehicle sales climbs from roughly a fifth of the market today toward near-universal by the mid-2030s, while true L3/L4 penetration follows a slower curve, starting in the low single digits today, crossing into double digits around 2030, and reaching majority status only by the late 2030s to early 2040s in leading markets.
Because the global vehicle fleet turns over slowly (the average car stays on the road for over a decade, longer in developing economies), the share of the operating fleet that’s actually autonomous lags new-sales penetration by many years. Even if every new car sold in 2035 were highly autonomous, most cars on the road that year would still be older, human-driven vehicles bought years earlier.
This lag matters enormously, because it means the transition isn’t a light switch. It’s a slow-moving wave where, for a long stretch of time, arguably the entire next decade, the roads are a mixed environment. Autonomous and semi-autonomous vehicles sharing space with a large, aging population of ordinary human-driven cars. That mixed environment turns out to be the most financially interesting period for the businesses sitting downstream of collisions, which is where Copart comes in.
It’s also worth flagging that the AV timelines have a long history of being overly optimistic. Robotaxi services and “full self-driving” have been promised as imminent for the better part of a decade, and regulatory approval, public trust, insurance frameworks, and edge-case software reliability have all taken longer than boosters expected. Any timeline in this report should be read as a central estimate surrounded by a wide range, skewed toward “later than projected” based on the industry’s track record.
The adoption curve, laid out
New-vehicle sales always lead, the in-use fleet catches up slowly behind them, which is the mechanical reason the “mixed roads” period lasts so long.
The table below is the full modeled timeline showing new-vehicle sales penetration for both L2+ and true L3/L4 autonomy, the resulting share of the in-use fleet that’s actually autonomous, and where that leaves absolute global collision volume and total loss frequency.
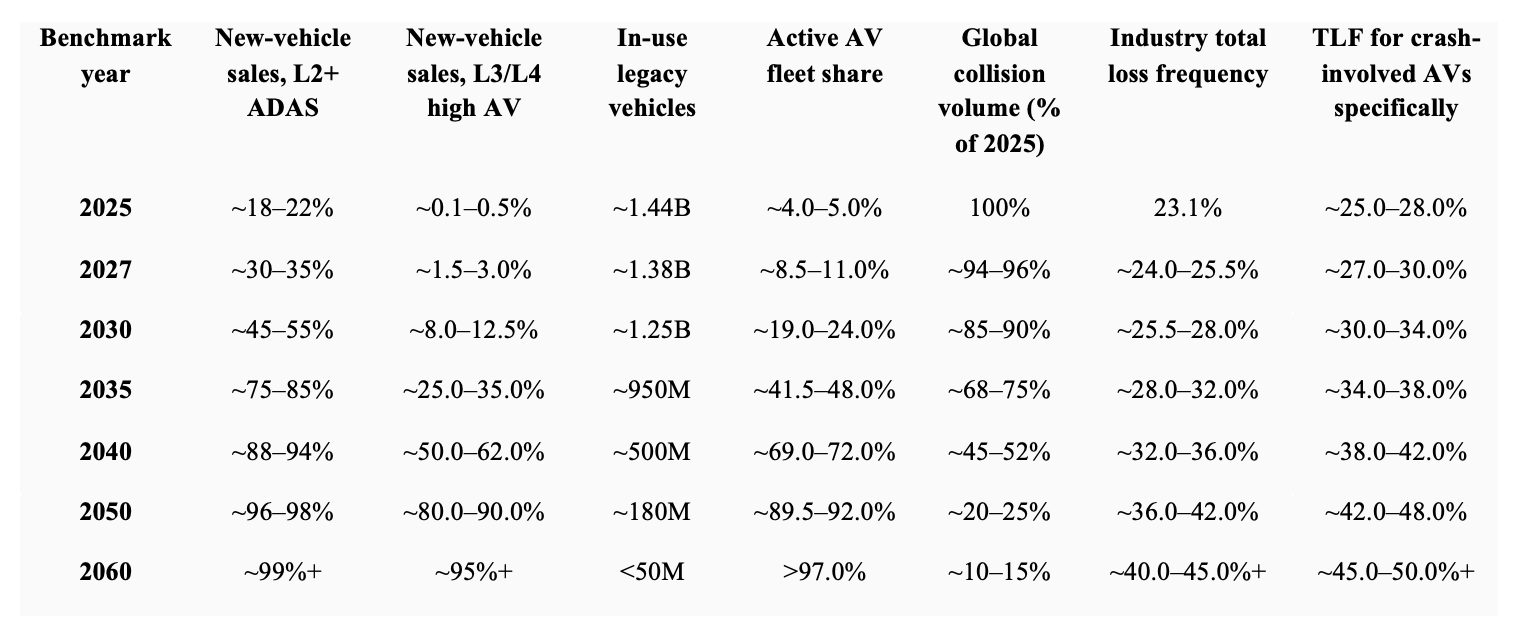
First, it is important to note that the in-use fleet column (”Active AV fleet share”) consistently lags the new-sales columns by years, that’s the slow-turnover effect discussed above, and it’s why the mixed-fleet period stretches out for so long.
Second, collision volume and total loss frequency move in opposite directions for the entire modeled horizon, they never really “resolve” into one trend; they’re a permanent tension that just shifts weight over time.
Part 2: Why AVs rewire car insurance from the ground up
For essentially the entire history of the automobile, insurance has been built around one core fact that humans make mistakes, and those mistakes are what insurers are pricing. Underwriting looks at the driver’s age, record, location, even credit score, because the driver is the primary source of risk. Claims get resolved by figuring out who was at fault, usually through police reports and eyewitness accounts.
Autonomous driving breaks that model at the root, because it removes the thing the whole system was built to price, which is human judgment behind the wheel. When software is making the driving decisions, responsibility for a crash starts shifting away from the person in the seat and toward whoever built the system, the automaker, the software developer, the sensor supplier, whoever wrote the code that made the call.
That’s a shift from personal tort law toward product liability, and it changes who buys insurance, what kind of insurance they buy, and how claims get investigated in the first place. A dispute over an AV collision increasingly turns into a forensic exercise, pulling sensor logs, camera footage, and software decision trails to figure out whether a piece of hardware failed, the software misjudged a scenario, or something else entirely happened. That’s a fundamentally different (and more expensive) process than reading a police report.
As this plays out, industry projections suggest the personal auto insurance market, historically the dominant chunk of the P&C insurance pie, could shrink substantially over a multi-decade horizon, with those premium dollars migrating toward commercial fleet policies, product liability coverage for automakers and software companies, and new categories like cyber-risk coverage for connected vehicle fleets. That’s a real structural drag for traditional personal-lines insurers. It is not, on its own, a drag for Copart, but it sets up the more interesting dynamic underneath it.
Frequency goes down, severity goes up, but they don’t cancel out.
Here’s the part that’s genuinely counterintuitive, safety technology is very good at preventing crashes, but it doesn’t make the crashes that still happen any cheaper, in fact, it usually makes them more expensive.
Features like automatic emergency braking and lane-keeping assistance are estimated to cut crash frequency meaningfully, on the order of high single digits to mid-teens percentage reductions for the specific coverages they affect, and full autonomous fleets should reduce it further still by removing distraction, fatigue, and impairment from the equation entirely. That’s real and it’s good news for road safety.
But think about where the sensors that make this possible actually live on the car, bumpers, side mirrors, windshields, grilles, exactly the parts of the vehicle most likely to get clipped in a minor fender-bender or parking mishap. Twenty years ago, that kind of minor damage meant popping off a plastic bumper cover and bolting on a new one. Today, it often means replacing a radar unit or camera module and then running a specialized recalibration procedure that requires certified technicians, proprietary software, and equipment most independent body shops don’t have. A relatively trivial bump can now trigger a repair bill that would have been unthinkable for equivalent damage a decade ago.
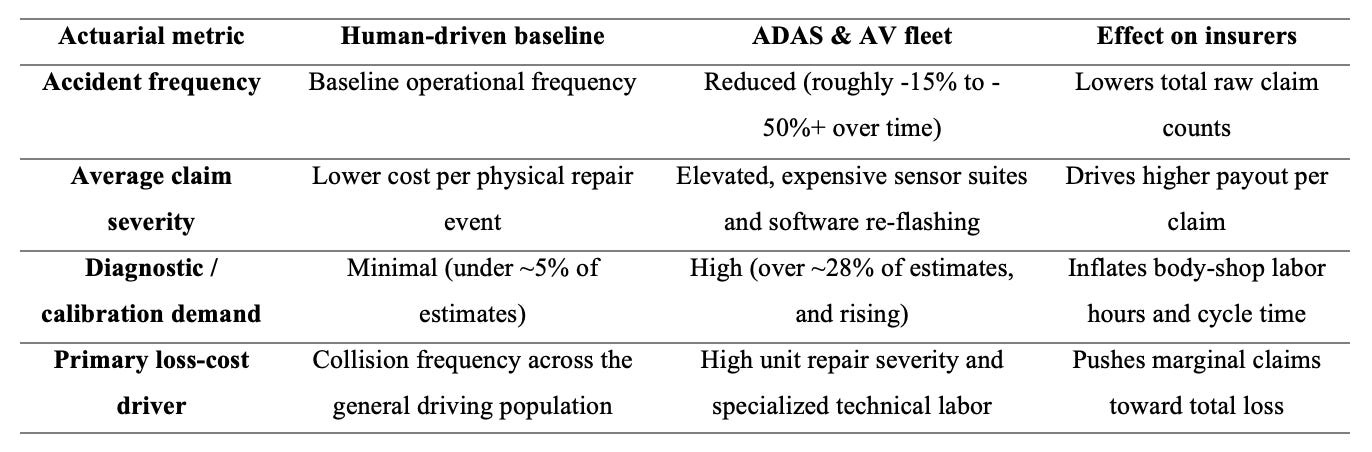
So you end up with two forces moving in opposite directions, fewer accidents, but each one that does happen costs more to fix. And critically, they don’t cancel out cleanly, because the cost side is compounding faster than the frequency side is shrinking, at least so far.
Laid out side by side, the divergence looks like this:
Part 3: The total loss math, and why it keeps climbing
Insurers don’t decide to total a car out of sentiment, it’s a straightforward economic threshold. If the estimated cost to repair a vehicle (plus related costs like a rental car during the repair) exceeds what the vehicle was worth before the crash, minus whatever the insurer can recover by selling the wreck for salvage, the math says total it out, not fix it.
That threshold has been moving steadily in one direction for decades, and the reason is that cars have gotten dramatically more complex. A vehicle from 1980 had essentially no onboard computing. A modern vehicle can carry well over a thousand microprocessors. Every one of those systems adds cost when it’s damaged and needs replacing or recalibrating. The result shows up directly in the data, total loss frequency, the share of insurance claims that end in a total loss not a repair, has climbed steadily for four decades, with sensor calibration now showing up in over a quarter of all collision repair estimates.
That’s not a projection, 1980 through today is observed history, which is part of why the near-term thesis in this report rests on a firm ground.
There’s also a friction point worth calling out, many automakers restrict independent repair shops from accessing the diagnostic tools and calibration software needed to fix modern sensor suites, funneling that work toward authorized dealer networks. Less competition on the repair side tends to mean higher repair estimates, which pushes more borderline cases over the total-loss threshold. This is a real dynamic today and, depending on how right-to-repair regulation evolves, could either intensify or ease over the coming years.
Put simply, the more sophisticated the sensor and compute hardware on a vehicle, the more likely a modest collision is to total it out. As AV-capable hardware becomes standard equipment, this dynamic should intensify, with total loss frequency across the industry plausibly climbing from today’s ~23% toward the low-to-mid 30s by the mid-2030s under the assumptions used here, and higher still, perhaps 40-50%, specifically for the subset of crashes involving AV-equipped vehicles, given how much more hardware they’re carrying.
Part 4: What this actually means for Copart
Copart processes something on the order of 40% of North American salvage vehicle auction volume, and its financial engine is really just two numbers multiplied together, how many total-loss vehicles flow into its lots, and what they sell for once they get there, and AVs affect both.
First, the drag that’s easy to see coming. As AVs and driver-assist systems reduce the number of crashes on the road, the raw pool of candidate vehicles entering the insurance claims pipeline shrinks. Fewer accidents, all else equal, means fewer cars for Copart to eventually process.
Second, the catalyst that offsets it, at least for a long while. As covered above, the vehicles that do crash are increasingly likely to be declared total losses rather than repaired, because of how expensive their sensor and compute hardware is to fix. So even as the number of accidents falls, a rising share of those accidents feed the salvage pipeline not the repair pipeline. For a meaningful stretch of time, plausibly the next five to ten years, while the roads are still dominated by a mix of older human-driven cars and increasingly tech-laden newer ones, this rising total-loss rate can offset, or even more than offset, the decline in raw crash counts. That’s a genuinely counterintuitive but reasonably well-supported near-term conclusion, crash frequency and Copart’s volume don’t have to move in the same direction.
Third, a quality and pricing effect that’s easy to overlook. Because higher repair costs push vehicles into salvage earlier in their lives, a two-year-old car with a damaged sensor suite may get totaled where a two-year-old car with a dented bumper wouldn’t have been, the vehicles landing at Copart’s auctions skew newer and more mechanically intact than the salvage inventory of twenty years ago. Better vehicles draw more competitive bidding, particularly from international buyers who operate in markets with lower labor costs and looser regulatory restrictions on rebuilding damaged cars. Higher average selling prices translate directly into higher fee revenue per vehicle for Copart, since its business model is largely built around auction and processing fees tied to sale value.
This international buyer demand is a real and currently active part of Copart’s model, it’s also a dependency worth flagging, it relies on continued cross-border demand and trade conditions that could shift with tariffs, regulation, or currency dynamics in ways this report doesn’t attempt to forecast.
Collision volume and total loss frequency cross paths somewhere in the 2030s under these assumptions, fewer crashes, but a bigger share of them worth more to Copart when they happen.
There’s a longer-horizon structural point too. As autonomous fleets scale, robotaxi networks, autonomous freight, vehicle ownership consolidates away from millions of individual retail owners toward large enterprise fleet operators. Those operators need serious physical infrastructure to store, stage, and process vehicles that are retired, damaged, or being decommissioned at the end of a duty cycle.
Copart owns north of 21,000 acres of real estate, much of it in locations near major metro areas that would be very difficult for a new entrant to replicate given zoning and permitting realities. That land footprint, combined with a strong balance sheet, positions Copart as a plausible long-term infrastructure partner for fleet operators managing large numbers of vehicles at scale, though it’s worth noting this is a strategic opportunity Copart would need to actively capture through contracts and relationships, not something that accrues automatically.
Part 5: A decade, roughly sketched out
Trying to pin exact numbers to exact years is a mug’s game this far out, but it’s useful to sketch the shape of the transition year by year to see where the crossover points plausibly sit. Please treat everything below as illustrative of a trend not an accurate forecast to bank on.
2026 - the record baseline. Fleet mix roughly 95% legacy, ~5% active AV/L2+. TLF sits at 23.1%, an industry record, with sensor calibration required on over 28% of estimates. Copart’s yards run near-maximum utilization on the back of high collision counts from legacy drivers hitting newer, sensor-heavy cars.
2027 - mass-market L2+ expansion. Fleet mix ~89–91% legacy. Hands-free features go standard on mid-tier consumer cars; perimeter damage on those cars becomes cost-prohibitive to repair, accelerating inflow of lightly damaged, 2-to-4-year-old vehicles and pushing ASPs higher.
2028 - the volume “sweet spot.” Fleet mix ~84–86% legacy. Absolute crash volume falls only modestly (roughly -2% to -4%) since legacy cars still dominate miles driven, while TLF climbs over 200 basis points versus 2025 — high volume multiplied by a meaningfully higher total-loss rate.
2029 - OEM diagnostic lockouts accelerate salvage. Fleet mix ~80–82% legacy. Automakers increasingly restrict independent shops from calibration software; repair estimates surge, pushing more borderline claims into salvage, with international buyers bidding aggressively for the resulting inventory.
2030 - the robotaxi and enterprise-fleet onset. Fleet mix ~76–81% legacy (new-sales penetration reaches ~50%). Commercial robotaxi networks expand across dozens of metro centers; Copart’s real estate footprint starts converting into direct enterprise staging and salvage contracts.
2031 - ASP expansion offsets the first real crash-volume dip. Fleet mix ~71–76% legacy. Global collisions decline a more noticeable 12–15% below the 2025 baseline, but revenue per vehicle rises as auction inventory skews newer and richer in salvageable hardware.
2032 - Level 3 “eyes-off” total losses spike. Fleet mix ~66–71% legacy. L3 conditional sedans reach the secondary market in real numbers; replacing dual-redundant steering, braking compute, and central processors after a highway collision pushes total-loss rates for crash-involved L3 vehicles above 30%.
2033 - peak international salvage arbitrage. Fleet mix ~61–66% legacy. Developing-market demand for lightly damaged, tech-rich 2026–2030 model-year vehicles is at its strongest, reinforcing high recovery values and the economic logic of totaling rather than repairing.
2034 - transition toward enterprise asset management. Fleet mix ~56–61% legacy. Absolute crash frequency is down roughly 25% from 2025, but Copart’s per-unit margins rise through EV battery handling, AV component harvesting, and fleet decommissioning services.
2035 - high-margin infrastructure hub. Fleet mix ~52–58% legacy (new-sales penetration near 94%). Over one in three claims now ends in a total loss. Copart’s role shifts from pure salvage auctioneer toward a broader staging, storage, and recycling infrastructure hub for the commercial AV fleet economy.
The broad pattern, the next five to eight years look like a genuinely favorable environment for Copart’s volume and pricing simultaneously. Past that point, the balance gradually shifts from “more volume” to “better economics on less volume” which is a very different growth story.
Part 6: The pivot after 2035, from growth engine to infrastructure utility
If the 2026–2035 stretch is characterized by strong, arguably double-digit-capable earnings growth driven by rising total loss rates and improving vehicle quality, the period beyond that looks structurally different.
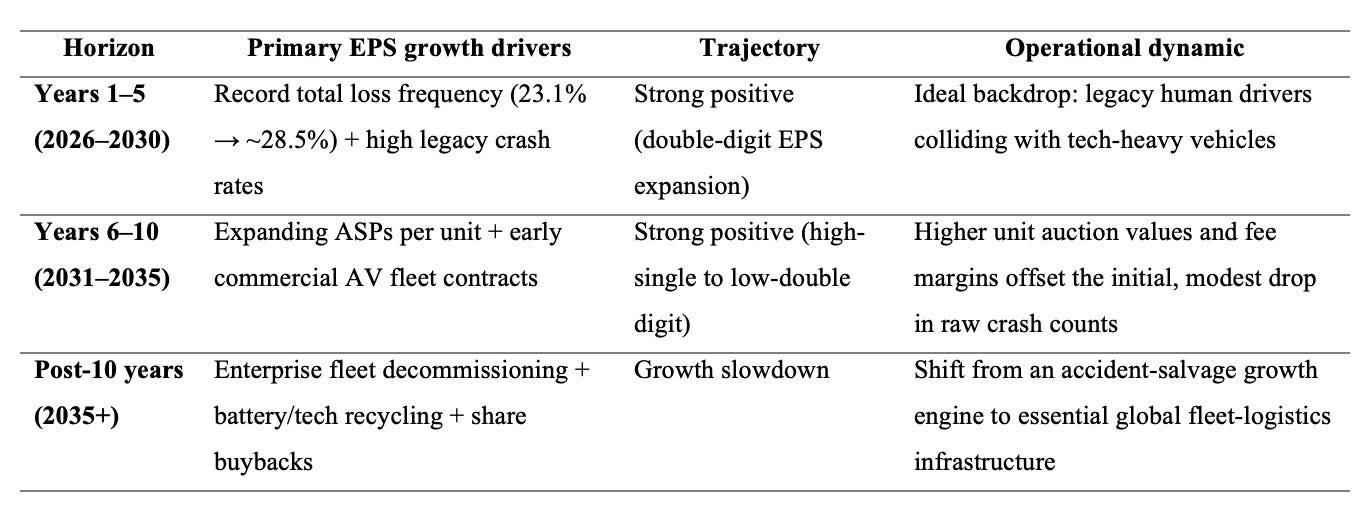
By the 2040s and beyond, under these assumptions, connected-vehicle networks and mature autonomous fleets could reduce total crash counts by half or more relative to today’s baseline. Even with total loss frequency staying elevated on a per-crash basis, the absolute number of vehicles flowing into the salvage system would eventually plateau or decline, simply because there are fewer crashes overall to draw from.
The offsetting factor in this later period is about fleet lifecycle management, commercial robotaxi and freight fleets run high-mileage duty cycles and get retired or decommissioned on a schedule, independent of whether they ever crash. That creates a different, steadier revenue stream tied to enterprise fleet turnover, battery recycling, and component harvesting. It’s a lower-growth, higher-margin, more utility-like business model, plausible, but it also depends on Copart successfully building out those enterprise relationships and specialized capabilities (high-voltage EV handling, fleet contracts) well ahead of when it needs them, which is an execution risk.
Part 7: The assumptions this whole analysis rests on
Since the conclusions here are only as good as the inputs, it’s worth listing the core assumptions plainly:
1. Fleet turnover and scrappage. Light vehicles last roughly 12–15 years in high-income markets, 18–22+ years in developing ones. New “legacy” (non-automated) vehicle production is assumed to fall from roughly 70 million units a year today to under 15 million by 2035 and under 1 million by 2050, while global scrappage and total-loss retirement removes 80–90 million vehicles a year, so the legacy fleet contracts steadily (from ~1.44 billion vehicles in 2025 toward under 50 million by 2060) even though it stays large for a surprisingly long time.
2. Total-loss threshold economics vs. repair labor. Repair cost for damaged AV/ADAS hardware is assumed to keep growing faster than a vehicle’s pre-accident value, consistent with the trajectory already observed from 4% (1980) to 23.1% (today). That pushes crash-involved AV total-loss rates toward the 40–50% range over time, even as absolute crash counts fall.
3. Secondary export-market arbitrage. Developed-market insurers are assumed to keep totaling lightly damaged, technology-dense vehicles because domestic repair labor is expensive; developing-market buyers are assumed to keep importing and rebuilding them at lower cost, which is what keeps Copart’s global auction prices supported.
4. Sensor cost deflation vs. hardware parity. LiDAR and sensor-suite costs are assumed to keep falling sharply (down roughly 65% between 2020 and 2025 already), reaching rough parity with traditional powertrain budgets around 2030–2032, the assumption that unlocks mass-market AV deployment.
5. Bifurcated regulatory and infrastructure speed. Frontrunner markets (US, China, Germany, UAE) are assumed to reach high L3/L4 new-sales penetration by 2038–2042; many developing markets are assumed to lag until 2048–2055 on infrastructure and regulatory grounds.
6. Global production bounds. Global light-vehicle manufacturing is assumed to hold in the 85–100 million unit per year range, with no assumed permanent bottleneck in semiconductor or sensor supply chains.
Part 8: Where this thesis could break, the case for skepticism
AV timelines could slip further than assumed. The industry’s track record on self-driving timelines has consistently run behind schedule. If L3/L4 adoption lags the curve used here by five or ten years, the near-term “total loss catalyst” story still probably holds (it depends more on L2+ sensor proliferation), but the later-decade transition to a fleet-management business model would also push out correspondingly, which isn’t necessarily bad for Copart but does compress the confidence of any specific-year projection.
Frequency reduction could outpace severity increases sooner than modeled. This report assumes total loss frequency gains continue offsetting crash frequency declines through the early 2030s. If safety technology matures faster than repair-cost inflation, or if repair costs come down (say, if right-to-repair regulation forces OEMs to open up calibration access, or if standardized sensor modules become cheaper and easier to replace), that crossover could arrive earlier, putting real pressure on Copart’s volumes sooner than this timeline suggests.
Insurance industry consolidation and self-insurance among fleet operators is a genuine wildcard. If large AV fleet operators (automakers, tech companies, ride-hail platforms) increasingly self-insure or vertically integrate their own salvage and remarketing operations rather than routing through independent auction platforms like Copart, that would undercut the “essential infrastructure partner” thesis regardless of how total loss rates trend.
International arbitrage demand isn’t guaranteed to persist. Copart’s pricing power depends significantly on strong overseas buyer demand for damaged vehicles. Trade policy shifts, tariffs, currency swings, or the same technology trends eventually reaching developing markets (making complex AV hardware harder to profitably rebuild anywhere) could all soften this dynamic.
Competitive dynamics matter. This report focuses on Copart in isolation, but its main competitor (IAA/RBA, now under Ritchie Bros.) faces the same industry catalysts and drags. Market share shifts between the major salvage platforms aren’t addressed here and could matter as much to Copart specifically as the industry-wide trends.
These are model outputs, not observed facts. Every percentage in the timeline tables is a projection built on the assumptions in Part 7, not a measured outcome. Treat the specific numbers as directional signals about the shape of the transition.
None of this reverses the core logic, the mechanical relationship between rising vehicle complexity and rising total loss frequency is well-supported by data already observed through 2025–2026, not just projected. But the further out the timeline goes, the more these uncertainties compound, and the 2040s-and-beyond picture should be held much more loosely than the 2026–2030 picture.
So, existential threat, or not?
Over the next decade, the data points to a positive impact on Copart. Rising total loss frequency (climbing from today’s record 23.1% toward the high-20s/low-30s by 2035) and improving vehicle quality at auction are on track to outweigh the gradual decline in raw accident counts. That’s a fairly well-supported near-term read, resting on a trend that’s already observed rather than purely projected.
In the long term, the data points to accident volumes diminishing sharply, potentially by half or more from today’s baseline by the 2040s and beyond, as connected-vehicle networks and mature autonomous fleets take hold. At that scale of decline, even a much higher total-loss rate per crash isn’t enough to sustain Copart’s current accident-salvage model on its own.
That means the long-term conclusion isn’t “Copart is fine”. It’s that Copart has to actively change what kind of business it is to stay viable. Leaning into enterprise fleet decommissioning, battery and component recycling, and infrastructure/logistics services built on its land and balance sheet, instead of continuing to ride pure accident-salvage volume. And even then, the fundamentals of that model will be uncertain, there’s no clear line of sight yet on how big that business ends up being, what growth rate it can sustain, or what margin profile it carries.
Thanks for this analysis, it’s really well laid out. Copart is one that’s been on my watch list for a while, and recently started digging in a bit to try to understand it better.
very well articulated with different potential scenarios with numbers. I believe that trend will benefit Copart, instead of acting as threat what I have observed historically..thanks for sharing!